Department Totals
Initial (Main Search) Screen
-
From the Reports > Sales Analysis Reports menu, select Department Totals Report.
-
An initial search screen (like the one shown below) should appear.
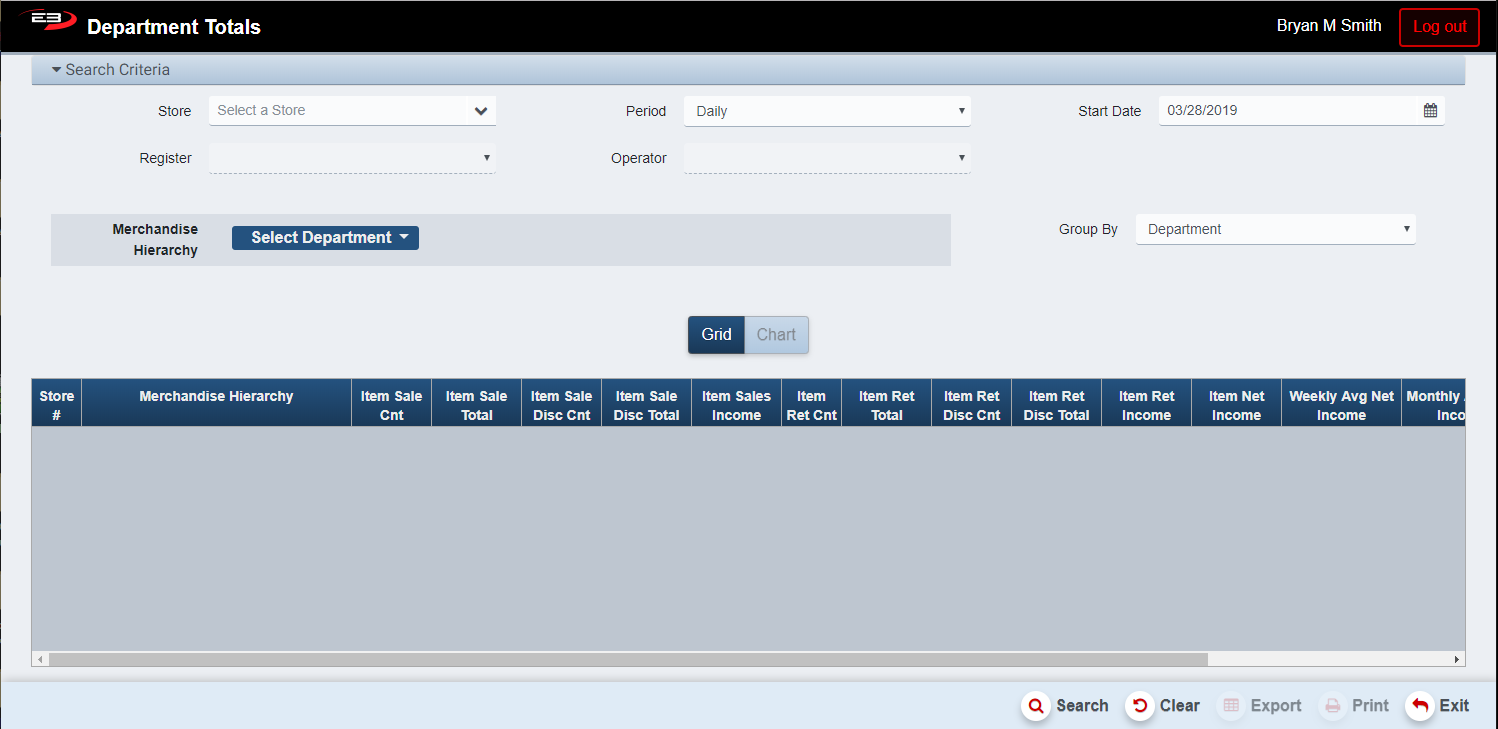
Screenshot of the Department Totals application.
-
Click Clear to reset the search criteria back to their default values and clear any results.
-
The user may select one or more stores from their store visibility list, default is all visible stores.
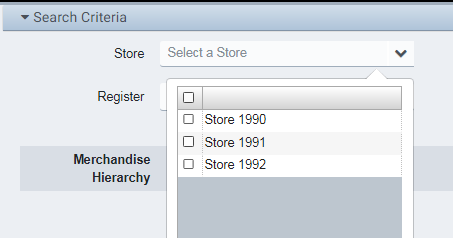
Screenshot of the Department Totals application.
-
The user may select a Period and Start Date to filter the results.
-
The Period values are Daily, Weekly, Monthly, Qtrly, and Yearly; default is Daily.
-
The Start Date has a default value for each of the period values and may also be manually set.
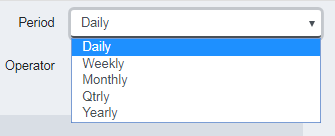
Screenshot of the Department Totals application.
-
The Register search filter limits the results to those from the specified register, and is disabled if more than one store is selected. Not selecting a register means “all registers that are visible”.
-
The Operator search filter limits the results to those from the specified operator, and is disabled if more than one store is selected. Not selecting an operator means “all operators”.
-
The Merchandise Hierarchy search filter limits the results to the selected department, class, or subclass; the default is all departments.
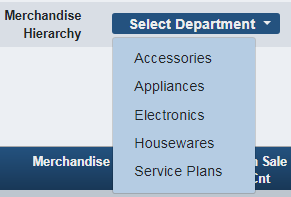
Screenshot of the Department Totals application.
-
The Group By configuration parameter defines how the results are to be grouped; the grouping can be by Department, Class, or Subclass; the default grouping is by Department.
-
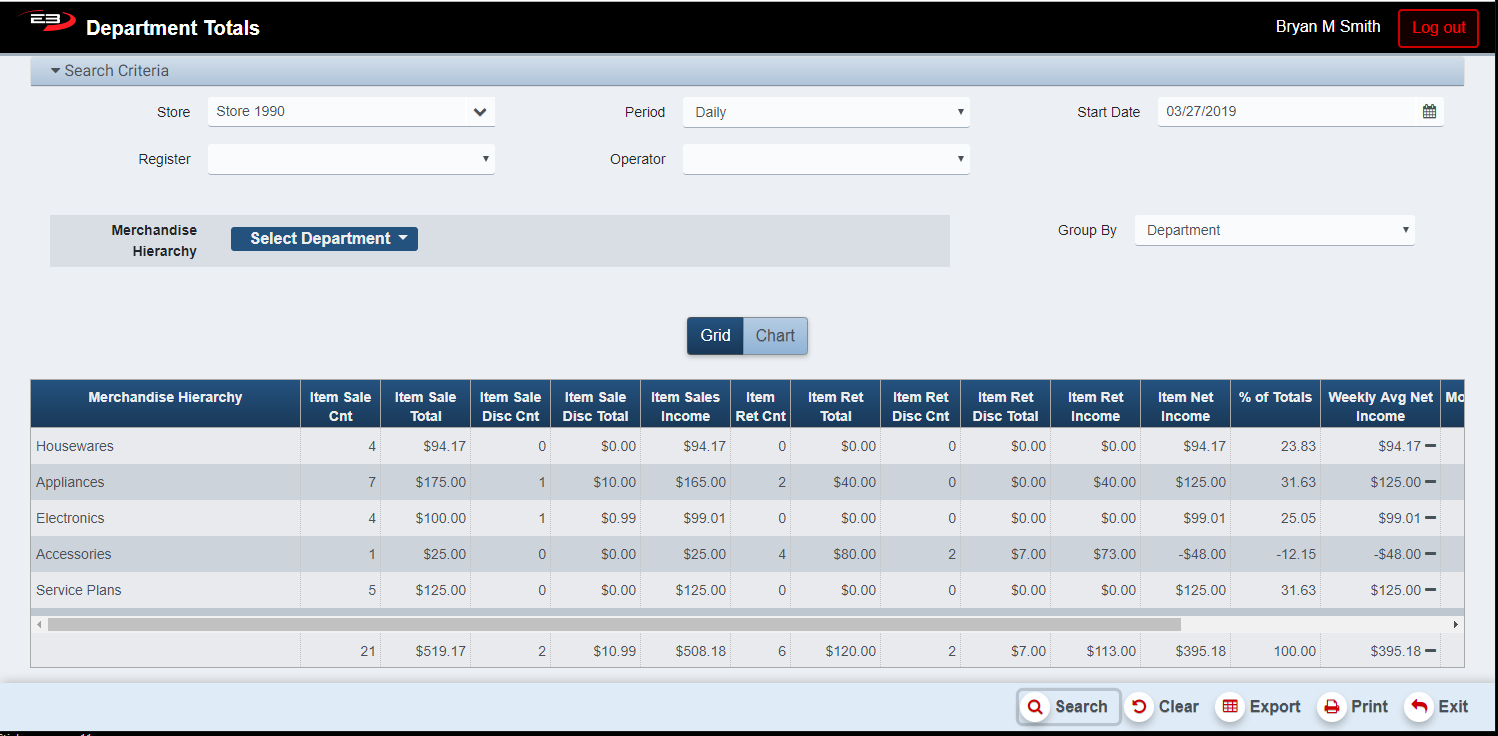
Click Search, the results will display like the following; this is data from a single store:
Screenshot of the Department Totals application.
-
The Average Total Retail Income values are based on time periods and are shown with trend indicators.
-
The trend indicators can be up, neutral, or down.
-
There is a summary row at the bottom of the merchandise hierarchy-based result rows.
Results
The results of the search, by default, are displayed in a grid. For all result sets, Average Retail Income values along with trending indicators are displayed.
-
Average Retail Income values based on time periods are shown with trend indicators.
-
Average income values and trends are only shown for time periods longer than the selected time period.
-
The trend indicators can be up, neutral, or down.
Results Grid
Single Store
-
Merchandise Hierarchy - can be Department, Department/Class, or Department/Class/Subclass
-
Item Sale Cnt - how many items were sold in this hierarchy
-
Item Sale Total - the total amount of items sold in this hierarchy
-
Item Sale Disc Cnt - how many items were sold in this hierarchy with a discount
-
Item Sale Disc Total - the total amount of items sold in this hierarchy with a discount
-
Item Sales Income - the sales total minus the sales discount total in this hierarchy
-
Item Ret Cnt - how many items were returned in this hierarchy
-
Item Ret Totals - the total amount of items returned in this hierarchy
-
Item Ret Disc Cnt - how many items were returned in this hierarchy with a discount
-
Item Ret Disc Total - the total amount of items returned in this hierarchy with a discount
-
Item Ret Income - the returns total minus the returns discount total in this hierarchy
-
Item Net Income - the net sales total minus the net returns total in this hierarchy
-
% of Totals - what percentage of the net income from all hierarchies, this is visible only if a single store was selected and a specific merchandise hierarchy was not selected
-
Weekly Avg Net Income - displayed if Period < Weekly, includes trend indicator
-
Monthly Avg Net Income - displayed if Period < Monthly, includes trend indicator
-
Qtrly Avg Net Income - displayed if Period < Quarterly, includes trend indicator
-
Yearly Avg Net Income - displayed if Period < Yearly, includes trend indicator
-
If there are multiple rows in the results, a summary row is displayed at the bottom of the grid
Multiple Store and Enterprise Results
Results from both multiple store and Enterprise searches include the Store # for each row in the results but do not contain % of Totals data. Otherwise the results for both of these searches can be considered the same.
-
Store # - the number of the store returning the results
-
If there are multiple rows in the results, a summary row is displayed at the bottom of the grid
Results Chart
-
Once values are present in the results grid, the Chart button becomes enabled.
-
Click the Chart button to display the results as a bar chart.
-
The drop-list allows selection of a Merchandise Chart or a Time Series Chart.
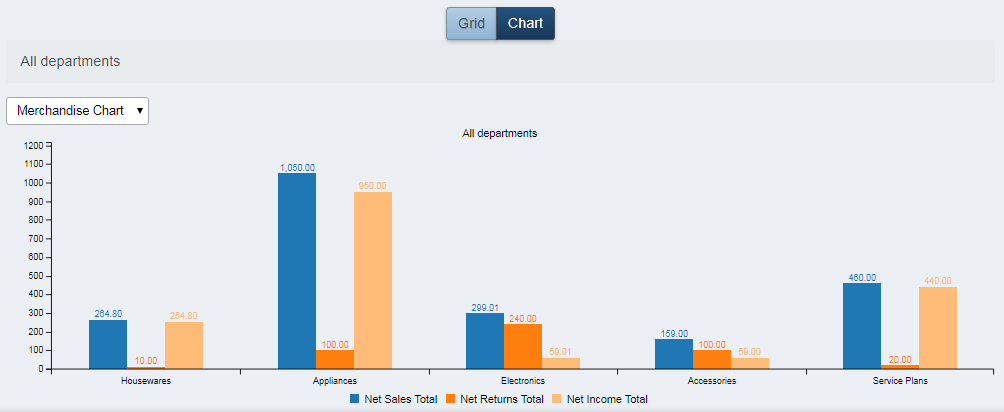
Screenshot of the Department Totals application.
- If you hover the mouse cursor over one of the MH result sets in the chart, you get a summary for that MH.
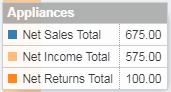
Screenshot of the Department Totals application.
Other Commands
Export
The Export function allows the user to save the report as a comma-separated values (CSV) file for use in Excel. Once you have a result set that’s filtered as desired, click the Export button. The file is saved as DepartmentTotals_yyyy-m-d.csv in the default location, typically the Downloads folder for the user.
The Print function allows the user to save the report as an Acrobat PDF file for viewing/printing in Adobe Acrobat Reader. Once you have a result set that’s filtered as desired, click the Print button. The file is saved as DepartmentTotals.pdf in the default location, typically the Downloads folder for the user.