Employee Sales Forecast
Initial (Main Search) Screen
-
From the Operator Management / Reports menu, select Employee Sales Forecast Report.
-
An initial search screen (like the one shown below) should appear.
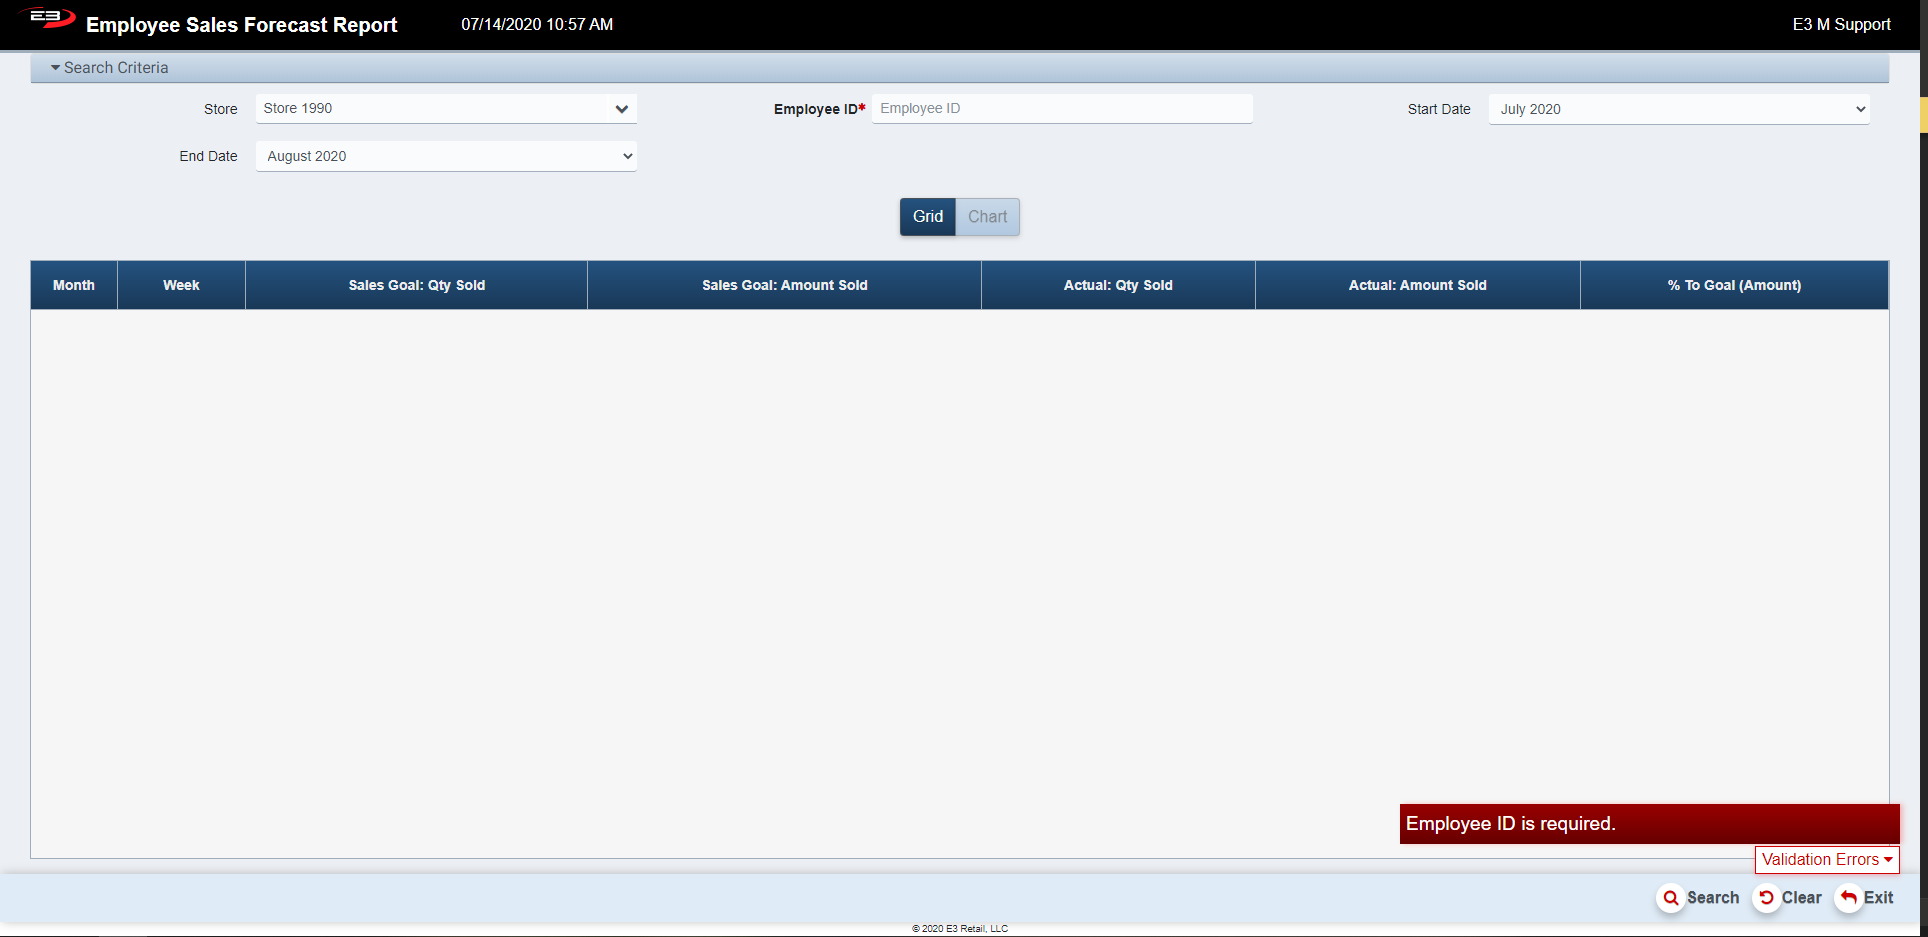
Screenshot of the Employee Sales Forecast application.
-
Click Clear to reset the search criteria back to their default values.
-
The Store value is required, only one store may be selected from the user’s store visibility list.
-
The user must select one store from their store visibility list, but if only one store is visible to the user, that store is selected by default.
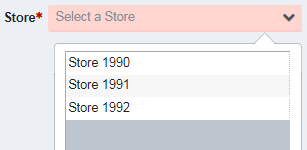
Screenshot of the Employee Sales Forecast application.
-
The Employee ID field is required. The user must enter a specific Employee ID number to enable search e.g. Emp1.
-
The Start Date field defaults to the present month but can be changed.
-
The End Date field defaults to next month but can be changed.
-
The Start Date and End Date fields cannot exceed a 12-month span.
-
Click Search, the results will display like the following.
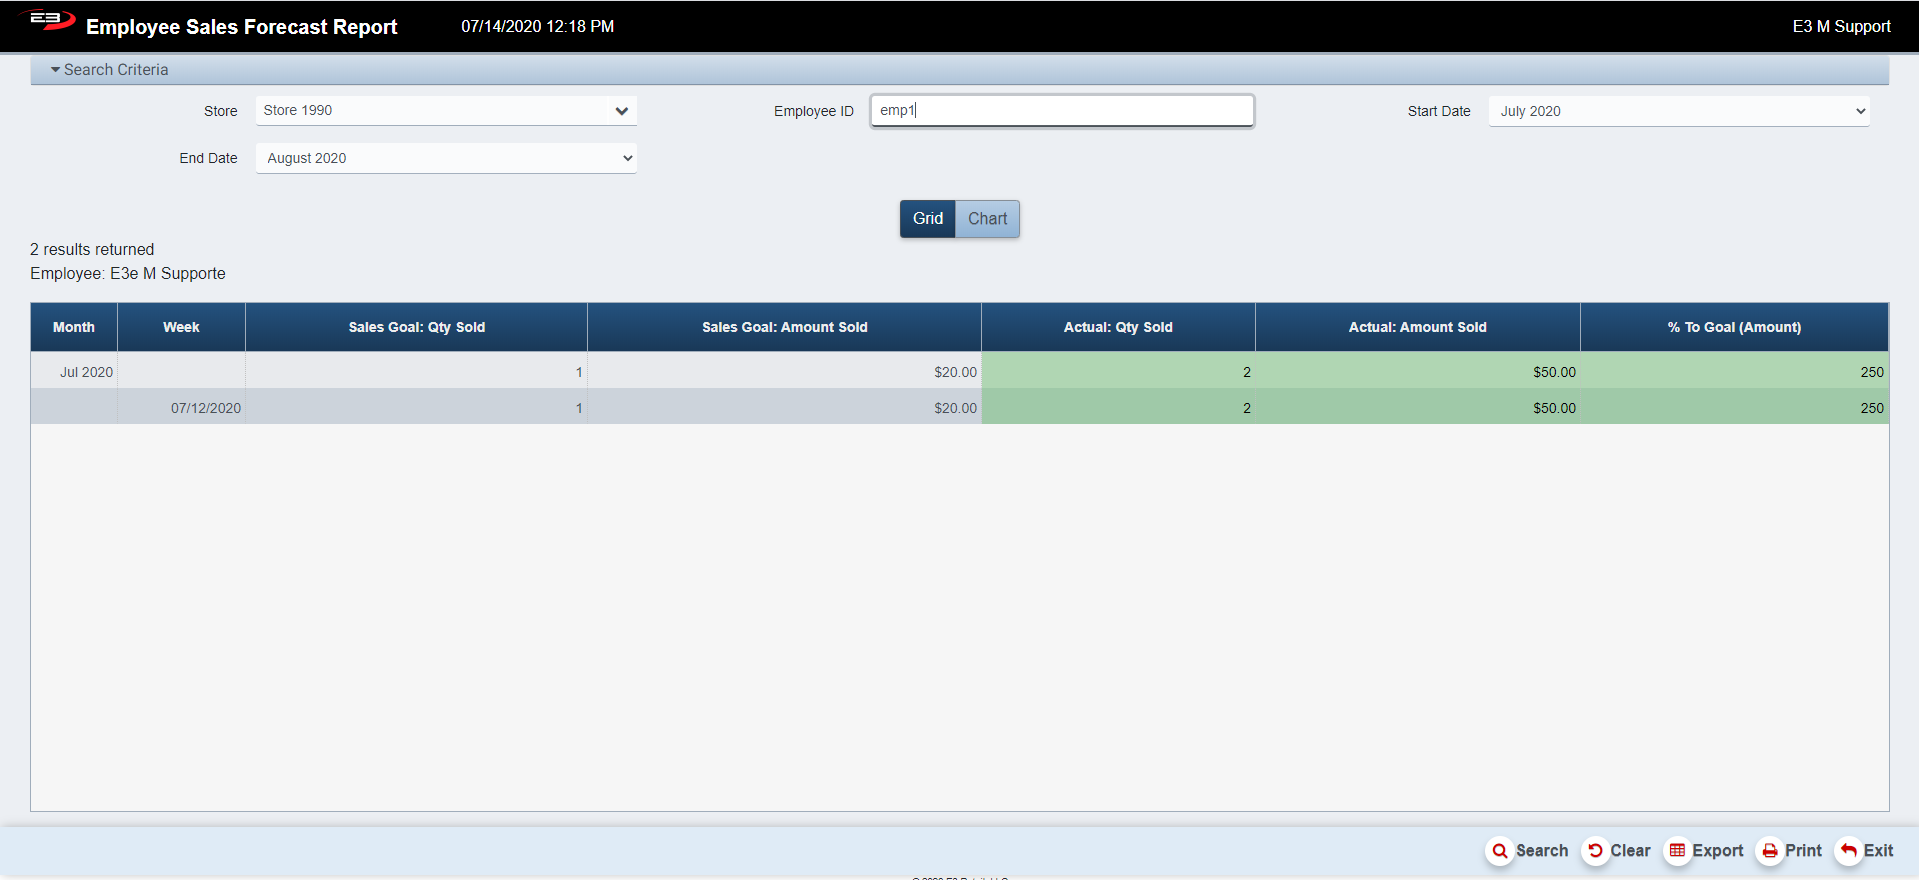
Screenshot of the Employee Sales Forecast application.
Results
Results Grid
By default, the results are displayed in grid form. The information displayed in the results table is based on the search criteria selected previously.
The following columns appear in the results grid:
-
Month – the month the sales goals/actual sales took place
-
Week – the week the sales goals/actual sales took place
-
Sales Goal: Qty Sold – the goal number of sales for the specific week
-
Sales Goal: Amount Sold – the goal amount in sales for the specific week
-
Actual: Qty Sold – the actual number of sales for the specific week
-
Highlighted in green if the quantity sold is greater than the sales goal
-
Highlighted in red if the quantity sold is less than the sales goal
-
-
Actual: Amount Sold – the actual amount in sales for the specific week
-
Highlighted in green if the amount sold is greater than the sales goal
-
Highlighted in red if the amount sold is less than the sales goal
-
-
% To Goal (Amount) – the percentage of actual amount of sales to the goal amount of sales
-
Highlighted in green if the % is greater than 100% of the goal amount
-
Highlighted in red if the % is less than 100% of the goal amount
-
Results Chart
-
Once values are present in the results grid, the Chart button becomes enabled.
-
Click the Chart button to display the results as a bar chart.
-
Results can be printed and/or exported in both chart and grid form.
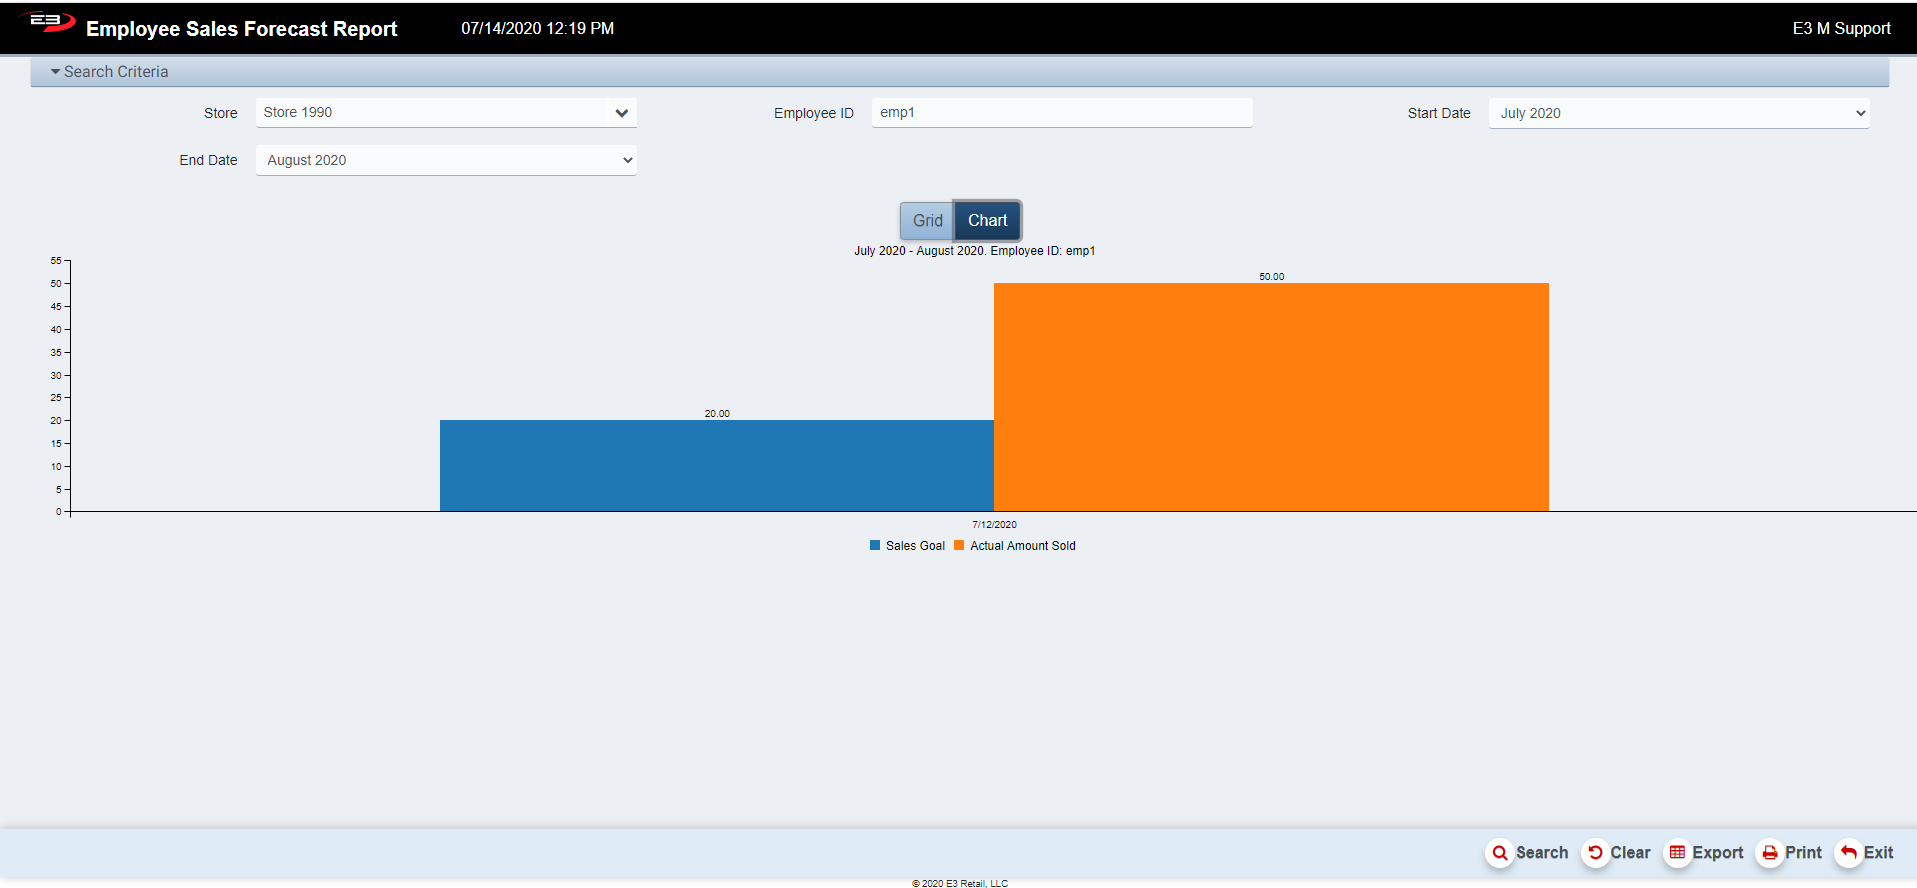
Screenshot of the Employee Sales Forecast application.
Other Commands
Export
The Export function allows the user to save the report as a comma-separated values (CSV) file for use in Excel. Once you have a result set that is filtered as desired, click the Export button. The file is saved as EmployeeSalesForecast-yyyy-m-d.csv in the default location, typically the Downloads folder for the user.
The Print function allows the user to save the report as an Acrobat PDF file for viewing/printing in Adobe Acrobat Reader. Once you have a result set that is filtered as desired, click the Print button. The file is saved as EmployeeSalesForecastReport.pdf in the default location, typically the Downloads folder for the user.