Hourly Sales
Initial (Main Search) Screen
-
From the Reports > Sales Analysis Reports menu, select Hourly Sales Report.
-
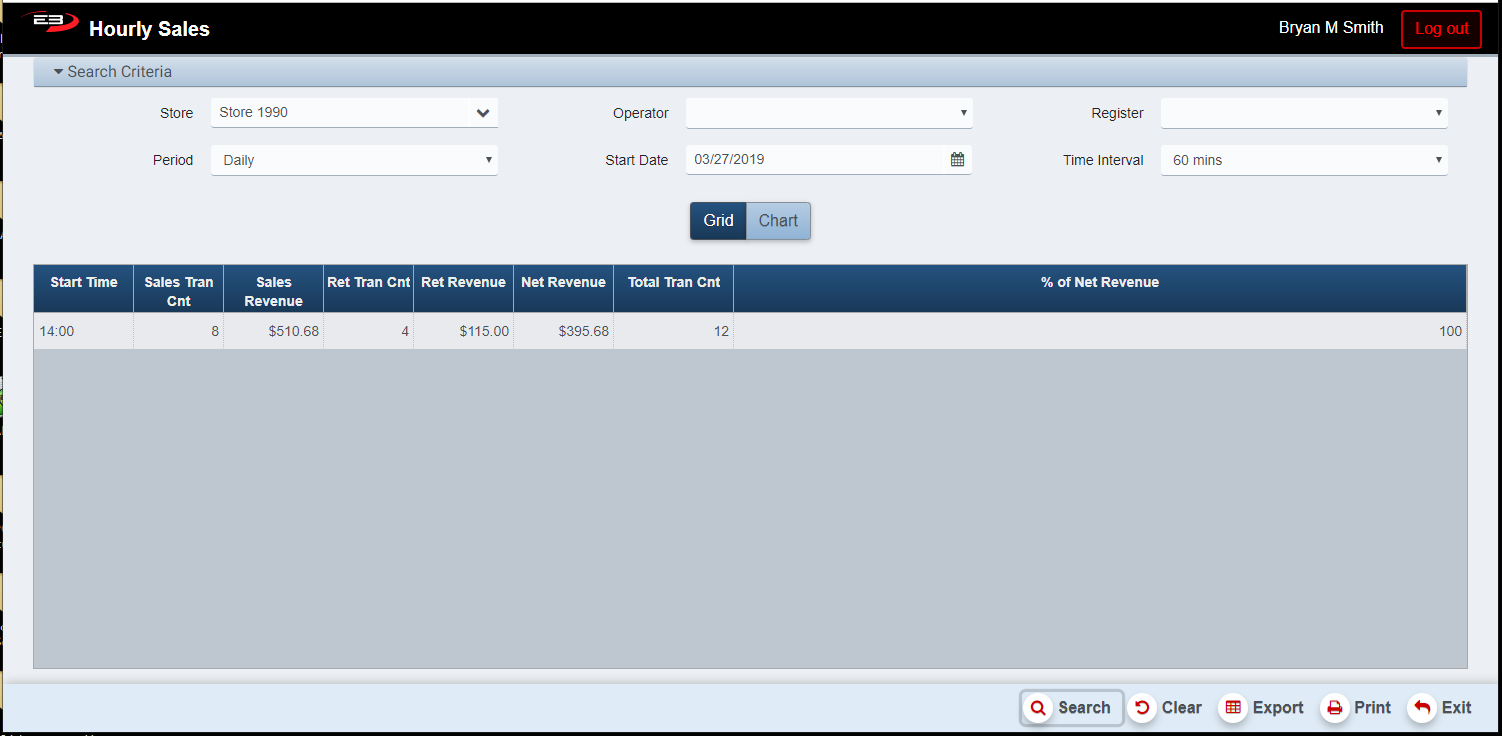
An initial search screen (like the one shown below) should appear.
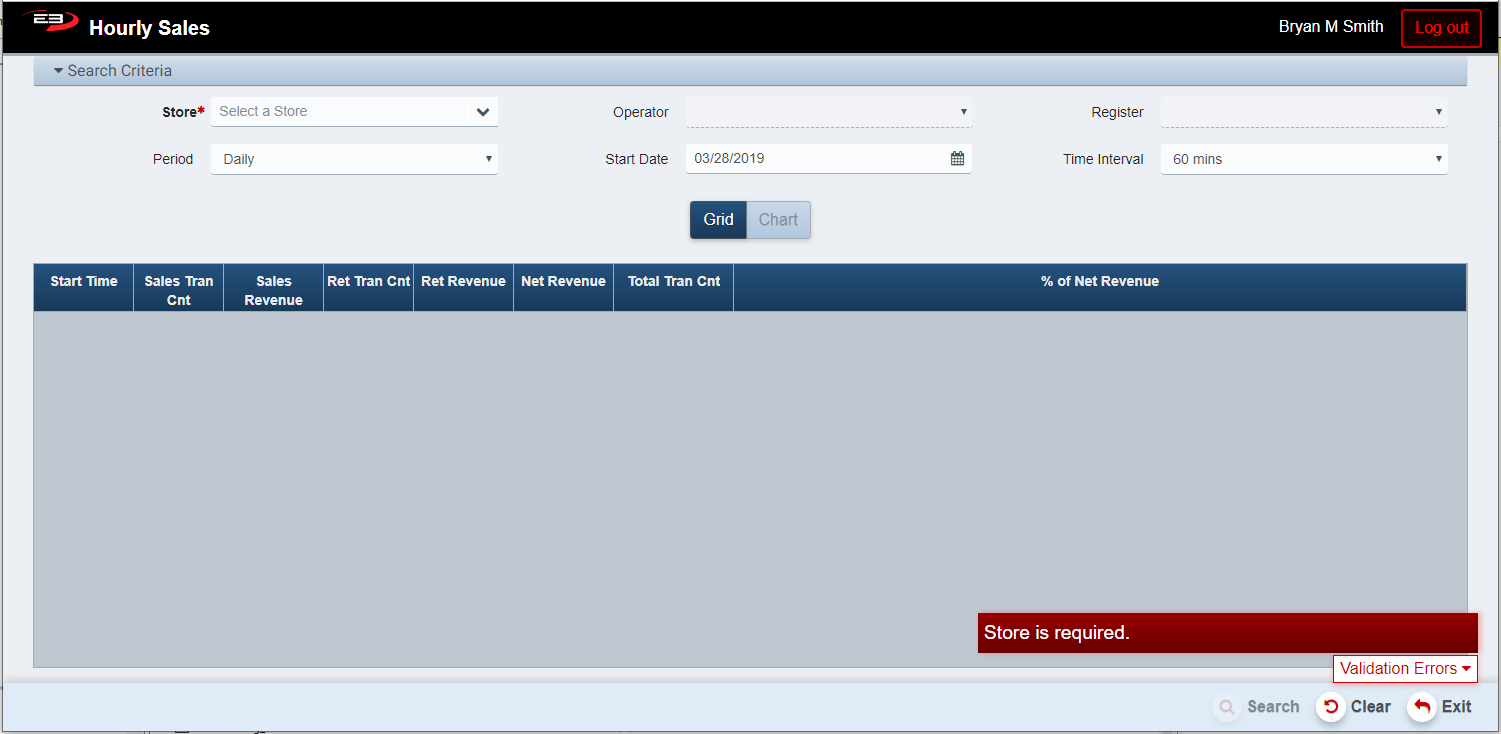
Screenshot of the Hourly Sales application.
- Select the desired Store from the store visibility list, this is a required field.
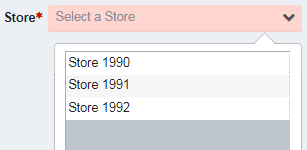
Screenshot of the Hourly Sales application.
-
The Operator search filter limits the results to those from the specified operator.
-
The Register search filter limits the results to those from the specified register.
-
The Period and Start Date values filter the results based on time.
-
Periods are: Daily, Weekly, Monthly, Qtrly, and Yearly.
-
The Start Date has a default value for each of the period values and may also be manually set.
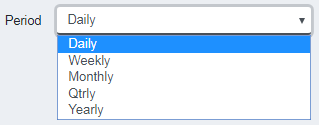
Screenshot of the Hourly Sales application.
- The Time Interval value provides one results row for each interval in the given period.
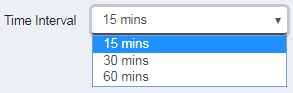
Screenshot of the Hourly Sales application.
-
Click Clear to clear any results and reset the search criteria to their default values.
-
Click Search, the results will display like the following:
Screenshot of the Hourly Sales application.
Results
Results Grid
The results of a search are displayed in a grid. The results are related to an interval of time, empty intervals are not displayed (i.e. no sales or return transactions occurred during the specified interval).
-
Start Time - this is the start time for each interval
-
Sales Tran Cnt - the number of sales transactions during the interval
-
Sales Revenue - this is the total amount from sales during the interval
-
Ret Tran Cnt - the number of return transactions during the interval
-
Ret Revenue - this is the total amount from returns during the interval
-
Net Revenue - this is Sales Revenue minus Returns Revenue during the interval
-
Total Tran Cnt - this is the number of transactions during the interval
-
% of Net Revenue - this is the percentage of total net income during the interval and may be negative if the amount from returns exceeds the amount from sales
A Summary row is at the bottom of the grid, this shows the totals of all columns except Start Time.
Results Chart
-
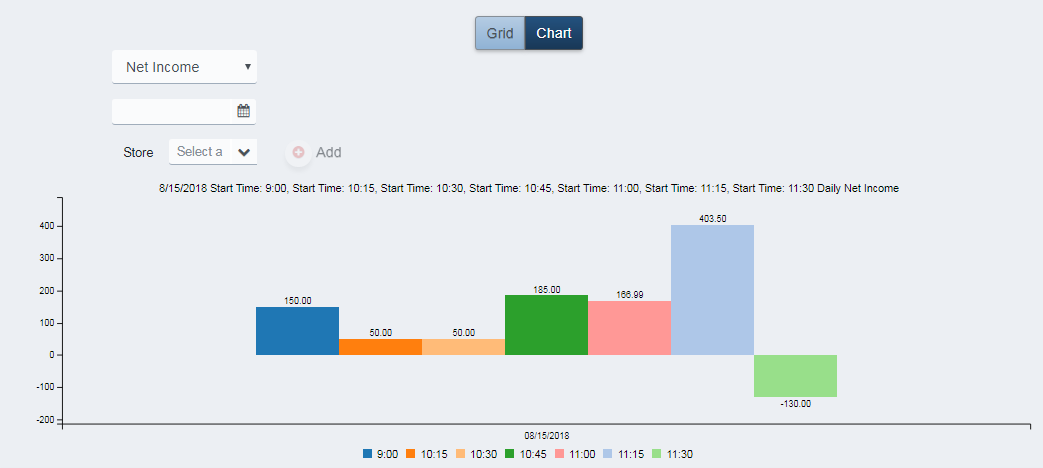
Once values are present in the results grid, the Chart button becomes enabled.
-
Click the Chart button to display the results as a bar chart.
Screenshot of the Hourly Sales application.
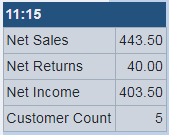
- Hover the mouse cursor over one of the time interval bars to see details for that time period.
Screenshot of the Hourly Sales application.
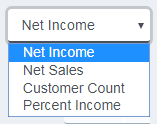
- The dropdown menu can select what data to chart.
Screenshot of the Hourly Sales application.
- The calendar control can select a single day to chart.
Screenshot of the Hourly Sales application.
- The Store selection can add stores to the data and chart.

Screenshot of the Hourly Sales application.
Other Commands
Export
The Export function allows the user to save the report as a comma-separated values (CSV) file for use in Excel. Once you have a result set that’s filtered as desired, click the Export button. The file is saved as HourlyTotals_yyyy-m-d.csv in the default location, typically the Downloads folder for the user.
The Print function allows the user to save the report as an Acrobat PDF file for viewing/printing in Adobe Acrobat Reader. Once you have a result set that’s filtered as desired, click the Print button. The file is saved as HourlyTotals.pdf in the default location, typically the Downloads folder for the user.