House Account Sales History
Initial (Main Search) Screen
-
From the Customer Management / Reports menu, select House Account Sales History Report.
-
An initial search screen (like the one shown below) should appear.
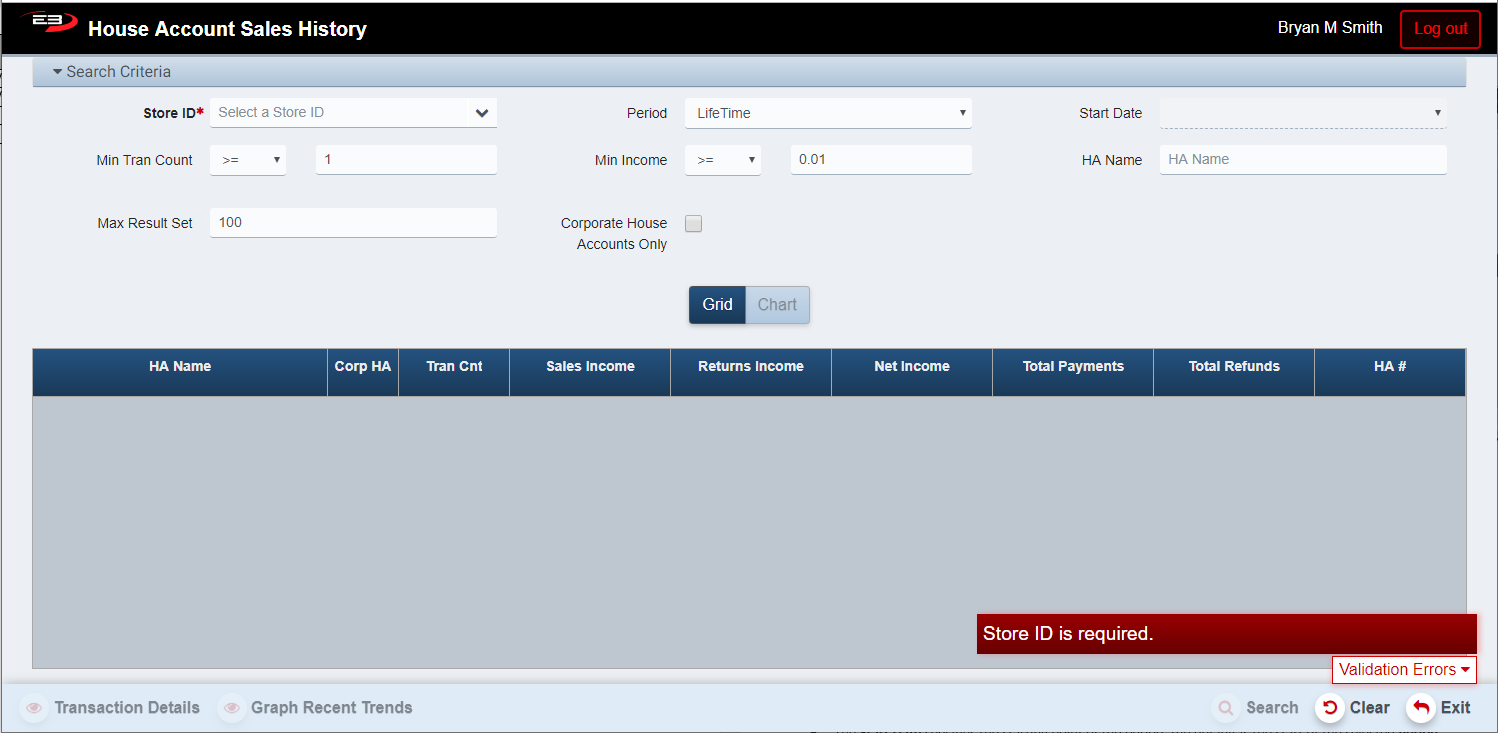
Screenshot of the House Account Sales History application.
-
Click Clear to reset the search criteria back to their default values.
-
The user must select a Store ID from the list, when a store is selected the Search button is enabled.
-
If only one store is visible, that store is selected by default.
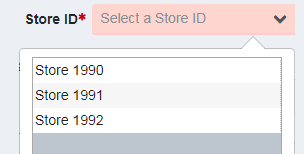
Screenshot of the House Account Sales History application.
-
The Period value lets the user select a time span in which to search.
-
The Period values are: Daily, Weekly, Monthly, Qtrly, Yearly, LifeTime.
-
The default Period value is LifeTime, there is no Start Date for LifeTime.
-
The Start Date specifies the starting point of the period, the default is the start of the selected Period.
-
The relational operators for Min Tran Count and Min Income are selected from a drop-list.
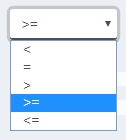
Screenshot of the House Account Sales History application.
-
Use Min Tran Count and the relational operator to filter on minimum transaction count for the HA.
-
Use Min Income and the relational operator to filter on minimum income for the HA.
-
Use HA Name to filter on starting characters of the house account name.
-
Use the Max Result Set value to limit the number of results returned, if this is exceeded a warning appears.
-
Check the Corporate House Accounts Only option to see corporate accounts.
-
Click Search to see the results, they will look something like this:
Screenshot of the House Account Sales History application.
-
Note that the Export and Print buttons become visible and enabled when there are results in the grid.
-
See the next section for details about the results.
Results
Results can be displayed as a grid or as a graph.
Results Grid
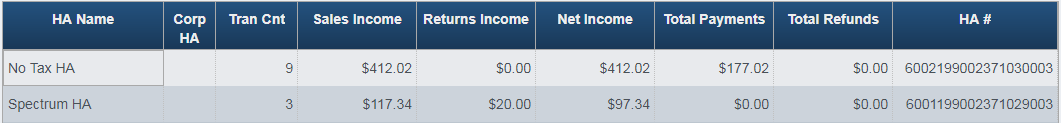
The result grid shows the various house accounts with transactions that met the search criteria, this is the default display. The columns in the result grid are:
-
HA Name - this is the name of the house account.
-
Corp HA - a checkmark indicates this is a Corporate house account.
-
Tran Cnt - this is the number of transactions associated with this house account.
-
Sales Income - this is the amount of income derived from item sales.
-
Returns Income - this is the amount of income derived from item returns.
-
Net Income - this is the Sales Income minus the Returns Income.
-
Total Payments - this is the total amount of payments made into the house account.
-
Total Refunds - this is the total amount of refunds made from the house account.
-
HA # - this is the internal house account identifier.
Results Chart
A single house account’s data may be displayed as a chart of activity over time. To see the chart, select a house account in the grid by clicking on the row and then clicking Graph Recent Trends.
Other Commands
Transaction Details
To see the transaction details for a house account, click on the house account row in the results grid and then click Transaction Details. The results will display as seen here, with a summary row on the top and then a grid of the individual transactions below. You can click on a single transaction and then click ViewEJ which will display the electronic journal entry for the transaction; click Exit to leave the EJ viewer and return to the transaction details.
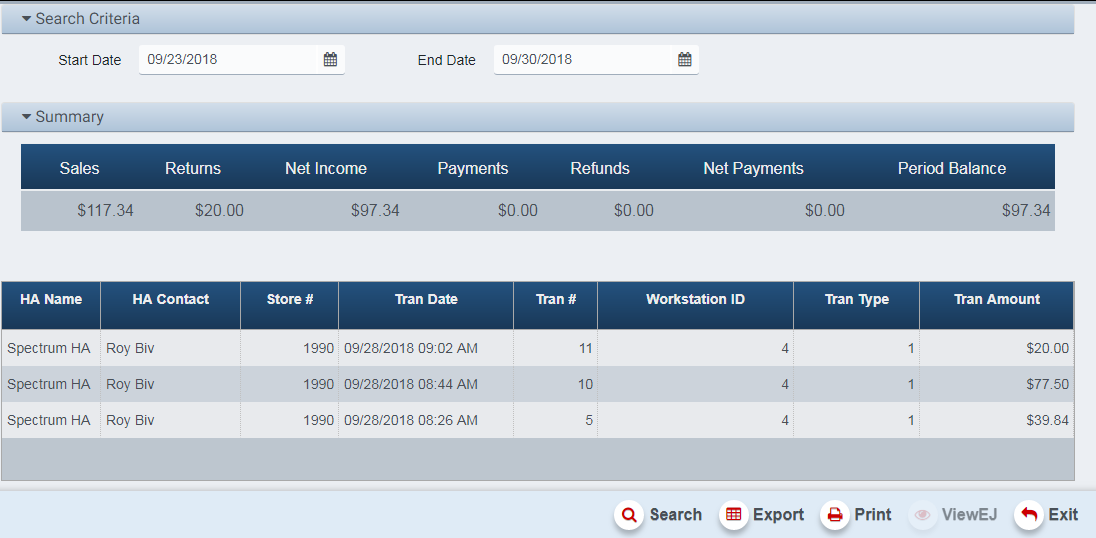
Screenshot of the House Account Sales History application.
Export
The Export function allows the user to save the report as a comma-separated values (CSV) file for use in Excel. Once you have a result set that’s filtered as desired, click the Export button.
-
The summary results are saved as HouseAccountSalesHistory_2018-9-28.csv
-
The transaction details are saved as Variances_2018-9-28.csv (which is broken)
The files are saved in the default location, typically the Downloads folder for the user.
The Print function allows the user to save the report as an Acrobat PDF file for viewing/printing in Adobe Acrobat Reader. Once you have a result set that’s filtered as desired, click the Print button.
-
The summary results are saved as HouseAccountSalesHistory.pdf
-
The transaction details are saved as TransctionDetails.pdf.
The files are saved in the default location, typically the Downloads folder for the user.