Item Sales History
Initial (Main Search) Screen
-
From the Reports > Sales Analysis Reports menu, select Item Sales History Report.
-
An initial search screen (like the one shown below) should appear.
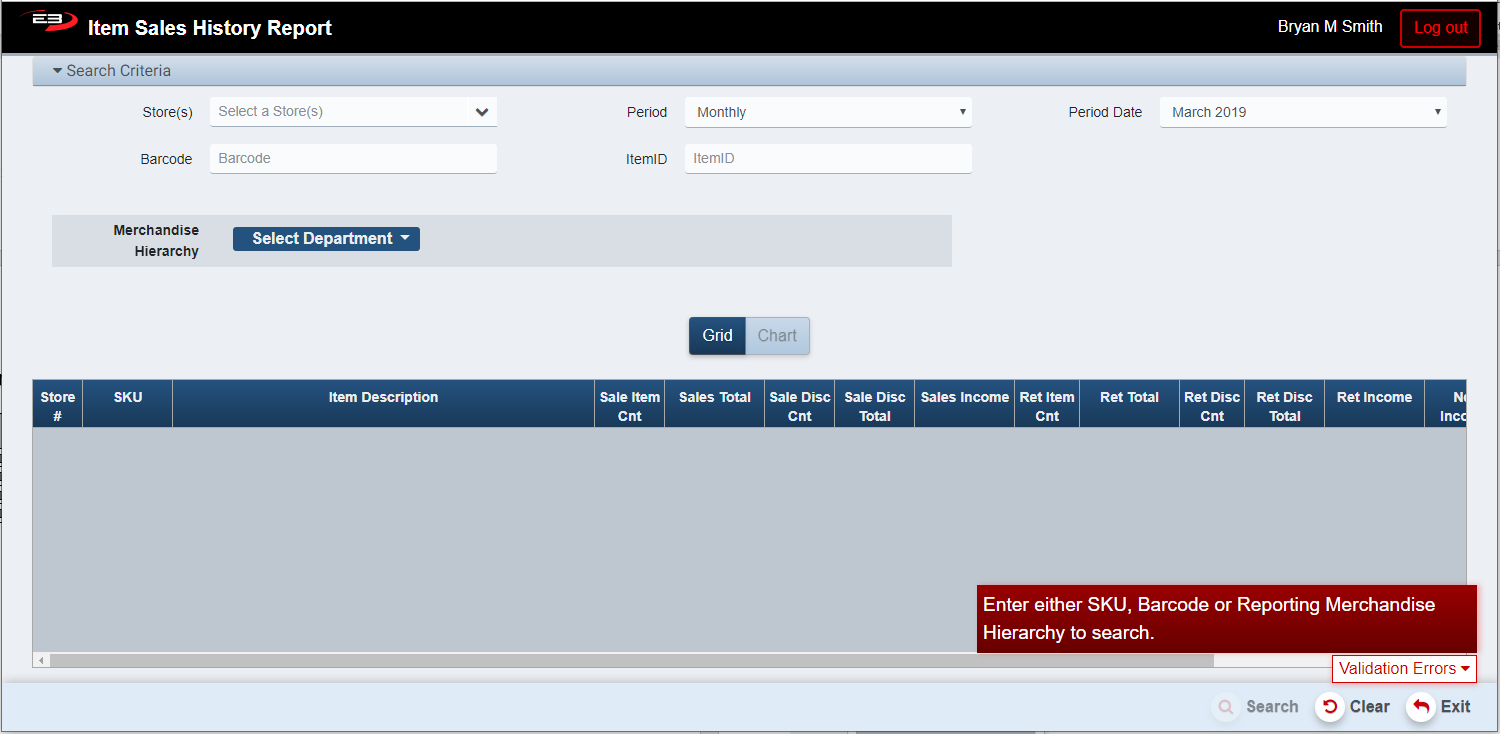
Screenshot of the Item Sales History application.
-
Click Clear to reset the search criteria back to their default values.
-
One of the SKU, Barcode, or Merchandise Hierarchy values must be set to perform the search.
-
The SKU or Barcode criteria will return data for a single item.
-
Merchandise Hierarchy may be Department, Department > Class, or Department > Class > Subclass.
-
The user may select one or more stores from their store visibility list, the default is all visible stores.
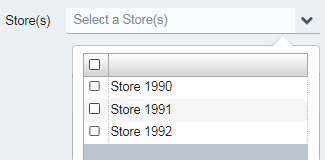
Screenshot of the Item Sales History application.
-
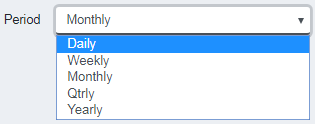
The user may also select a Period and Start Date to filter the results.
-
Periods are: Daily, Weekly, Monthly, Qtrly, and Yearly, the default period is Monthly.
-
The Start Date has a default value for each of the period values and may also be manually set.
Screenshot of the Item Sales History application.
- Click Search, the results will display like the following:
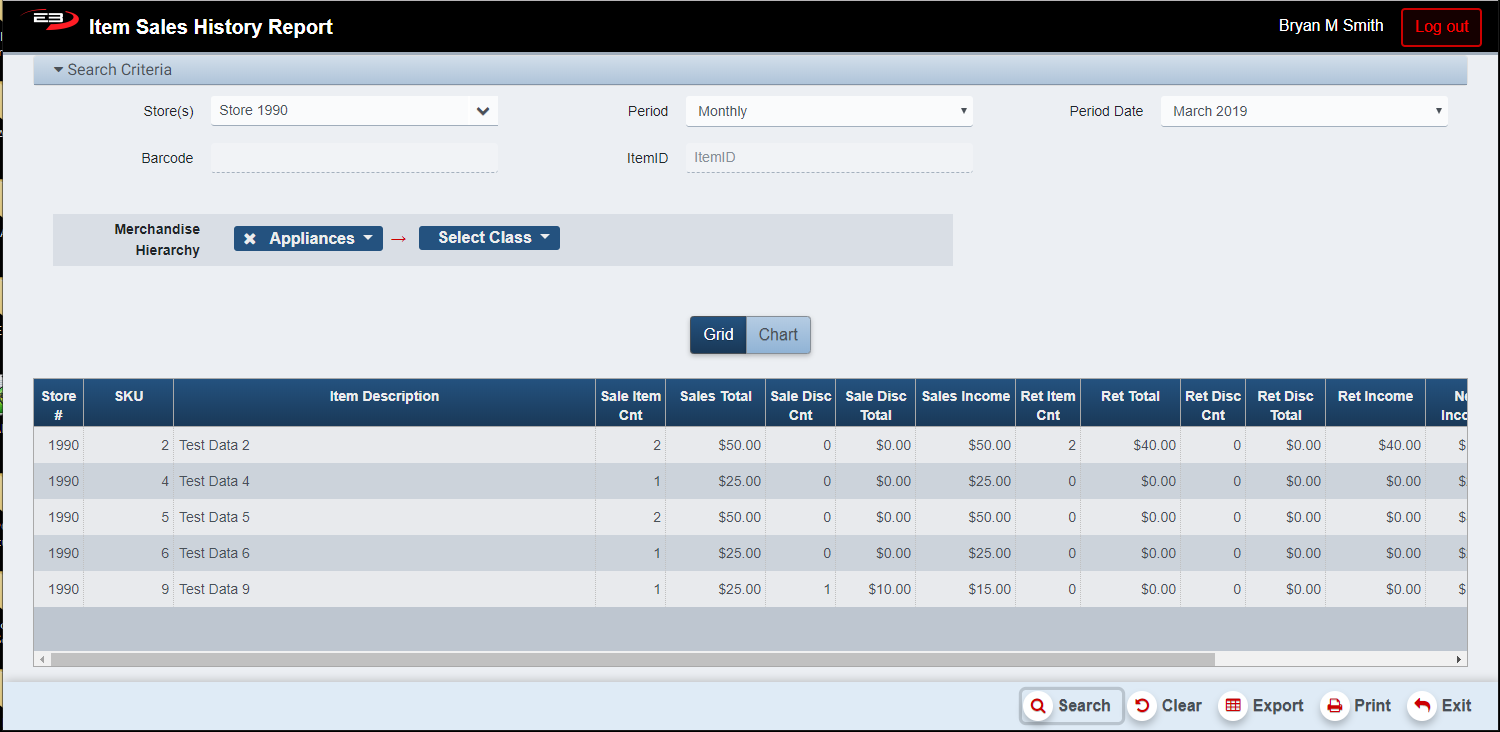
Screenshot of the Item Sales History application.
Results
As previously noted, the results may be viewed as a grid or as a bar chart.
Results Grid
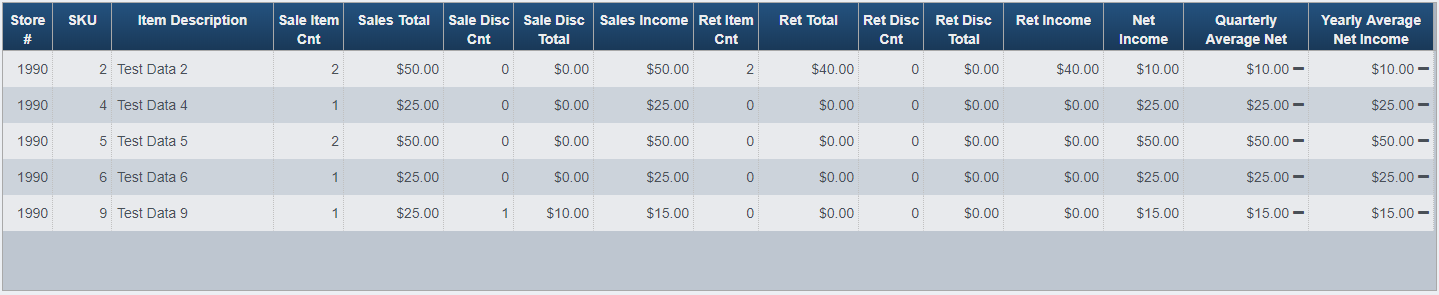
The results grid always contains the following columns, each combination of item and store gets a row in the results.
Screenshot of the Item Sales History application.
-
Store # - the store number of the item(s) sold in the selected time period.
-
SKU - the SKU for the particular item sold in the selected time period.
-
Item Description - the description of the item, if the SKU is not recognized it will say Item Not Found.
-
Sale Item Cnt - how many of the items were sold.
-
Sales Total - what was the total amount for the specified number of items sold.
-
Sale Disc Cnt - how many of the items were sold at a discount.
-
Sale Disc Total - what was the total discount amount for the number of items sold at a discount.
-
Sales Income - this is the sales total minus the sales discount total.
-
Ret Item Cnt - how many of the items were returned.
-
Ret Total - what was the total amount for the specified number of items returned.
-
Ret Disc Cnt - how may of the items returned were returned at a discount.
-
Ret Disc Total - what was the total discount amount for the items returned at a discount.
-
Ret Income - this is the return totals minus the return discount totals.
-
Net Income - this is Sales Income minus Ret Income.
In addition, there will be columns for period average net income for any period greater than the one selected for the search. For example, if you selected Monthly as the period then there will be average net income values for the Quarterly and Yearly periods. Selecting Daily gives values for Weekly, Monthly, Quarterly, and Yearly periods. The trend indicators displayed with the monthly averages may be up, neutral, or down.
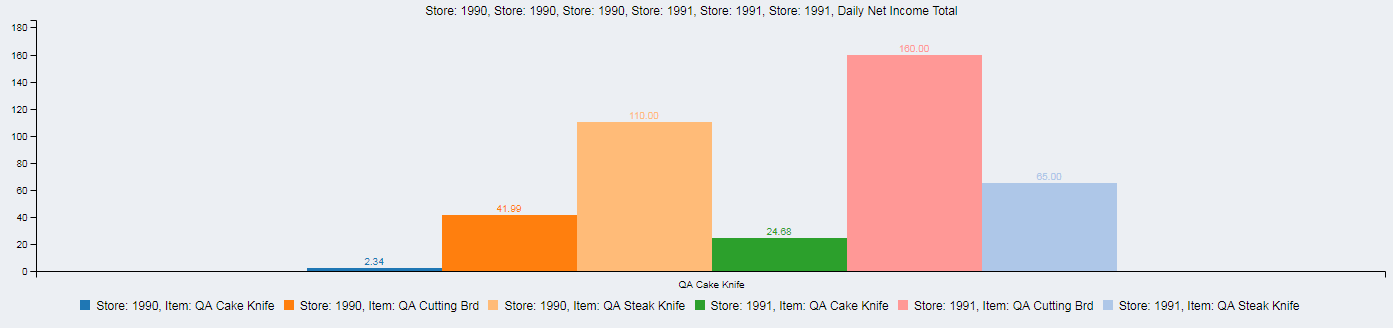
Results Chart
-
Once values are present in the results grid, the Chart button becomes enabled.
-
Click the Chart button to display the results as a bar chart.
Screenshot of the Item Sales History application.
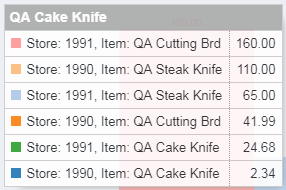
- Hover the mouse cursor over one of the bars to see details for the chart, sorted in descending order.
Screenshot of the Item Sales History application.
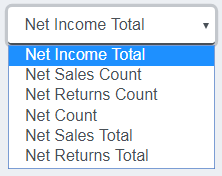
- Which column is to be reported in the chart can be set by picking an entry from the dropdown menu:
Screenshot of the Item Sales History application.
- Additional periods can be added he starting date for the selected period can be set using the calendar control:

Screenshot of the Item Sales History application.
Other Commands
Export
The Export function allows the user to save the report as a comma-separated values (CSV) file for use in Excel. Once you have a result set that’s filtered as desired, click the Export button. The file is saved as ItemSalesHistory_yyyy-m-d.csv in the default location, typically the Downloads folder for the user.
The Print function allows the user to save the report as an Acrobat PDF file for viewing/printing in Adobe Acrobat Reader. Once you have a result set that’s filtered as desired, click the Print button. The file is saved as ItemSalesHistoryReport.pdf in the default location, typically the Downloads folder for the user.