Operator Totals
Initial (Main Search) Screen
-
SignOn to the Back Office.
-
From the Operator Management / Reports menu, select Operator Totals Report.
-
An initial search screen (like the one shown below) should appear.
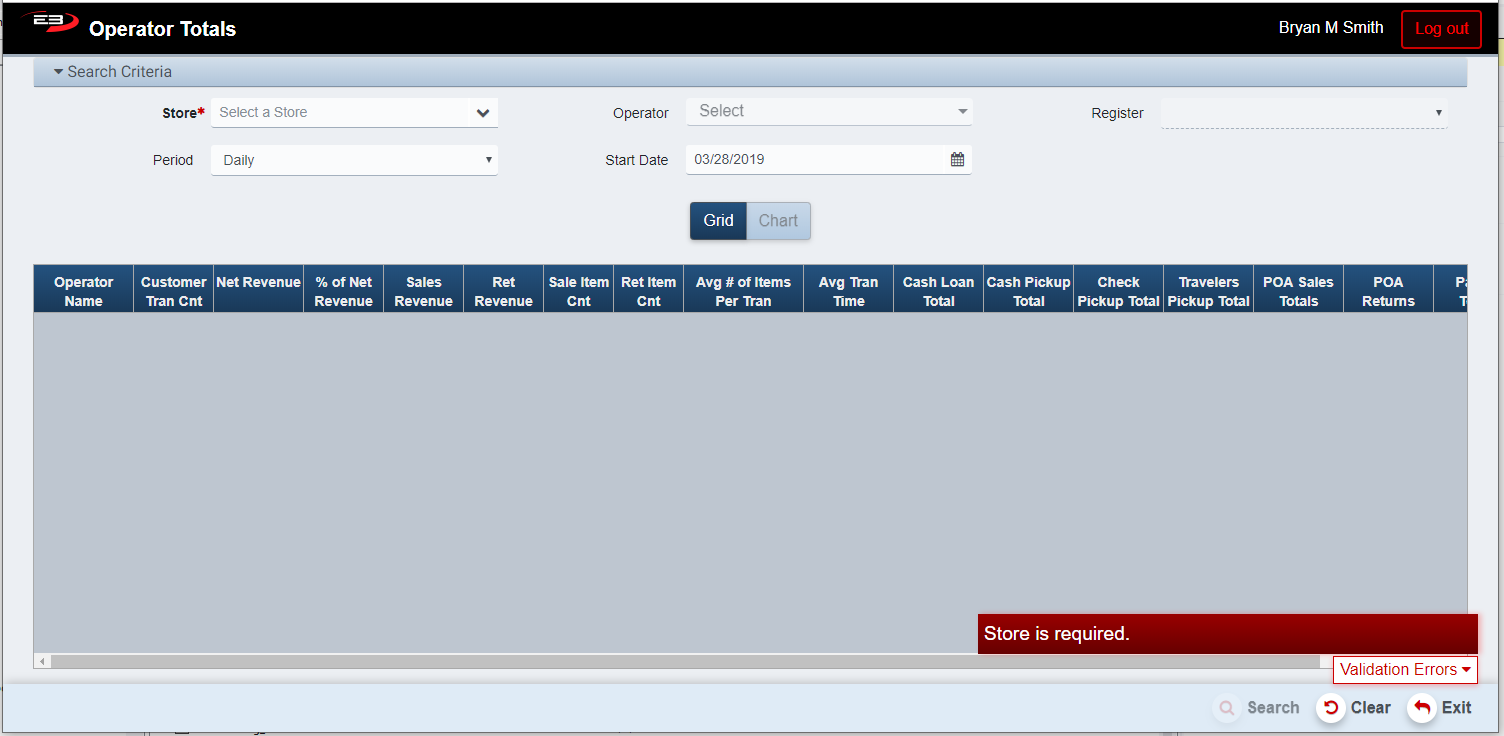
Screenshot of the Operator Totals application.
-
Click Clear to reset the search criteria back to their default values.
-
The Store value is required, only one store may be selected from the user’s store visibility list.
-
If only one store is visible to the user, that store is selected by default.
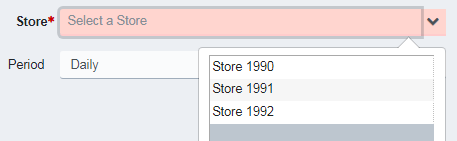
Screenshot of the Operator Totals application.
-
Once the store is selected, visible operators and registers are selectable from the Operator and Register criteria.
-
The user may also select a Period and Start Date to filter the results.
-
Periods are: Daily, Weekly, Monthly, Qtrly, and Yearly.
-
The Start Date has a default value for each of the period values and may be manually set as well.

Screenshot of the Operator Totals application.
- Click Search, the results will display like the following.
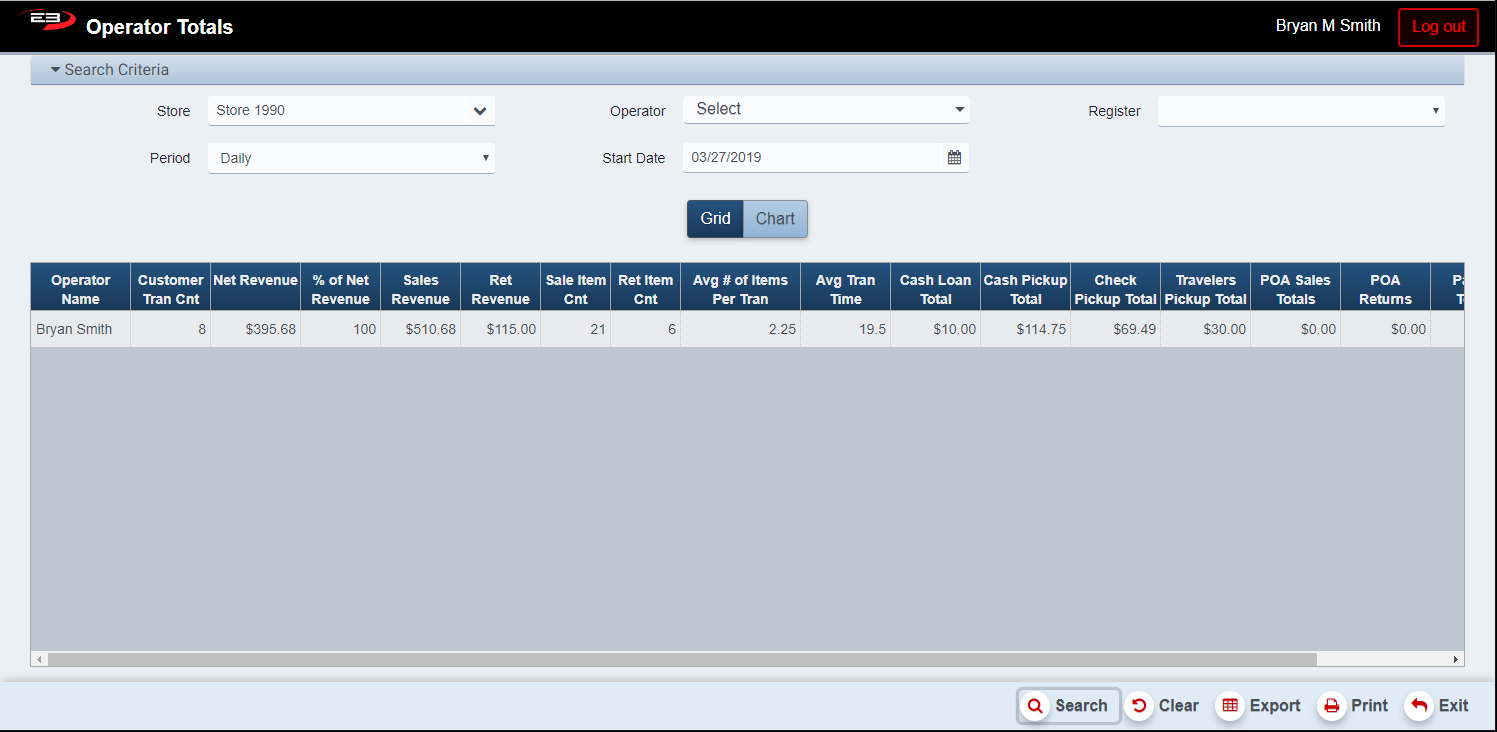
Screenshot of the Operator Totals application.
-
If the operator’s name is available it is used, otherwise the operator’s ID number is displayed.
-
If more than one operator has data, each operator gets a row and there is also a summary row at the bottom.
Results
Results Grid
By default, the results are displayed in grid. Each operator with results from the selected store and period, and optionally from the selected register, gets a row in the results. If more than one operator has a row in the grid, a summary row is also displayed.
The following columns appear in the results grid:
-
Operator Name - the name of the operator
-
Customer Tran Cnt - how many sale/return transactions for this operator
-
Net Revenue - sales revenue minus returns revenue
-
% of Net Revenue - this operator’s portion of the total net income for all operators
-
Sales Revenue - item sales total plus sales tax total minus (promotions + manual discounts + price overrides)
-
Ret Revenue - item return total plus return tax total minus (promotions + manual discounts + price overrides)
-
Sale Item Cnt - how many items were sold
-
Ret Item Cnt - how many items were returned
-
Avg # of Items Per Tran - (sale items + return items) divided by (sale tran count + return tran count)
-
Avg Tran Time - total transaction time divided by (sale tran count + return tran count)
-
Cash Loan Total - total amount of loans
-
Cash Pickup Total - total amount of cash picked up
-
Check Pickup Total - total amount of checks picked up
-
Travelers Pickup Total - total amount of traveler’s checks picked up
-
POA Sales Totals - payment on account sales
-
POA Returns - payment on account returns
-
Paid In Totals - paid in total amount
-
Paid Out Totals - paid out total amount
Results Chart
Once values are present in the results grid, the Chart button becomes enabled.
-
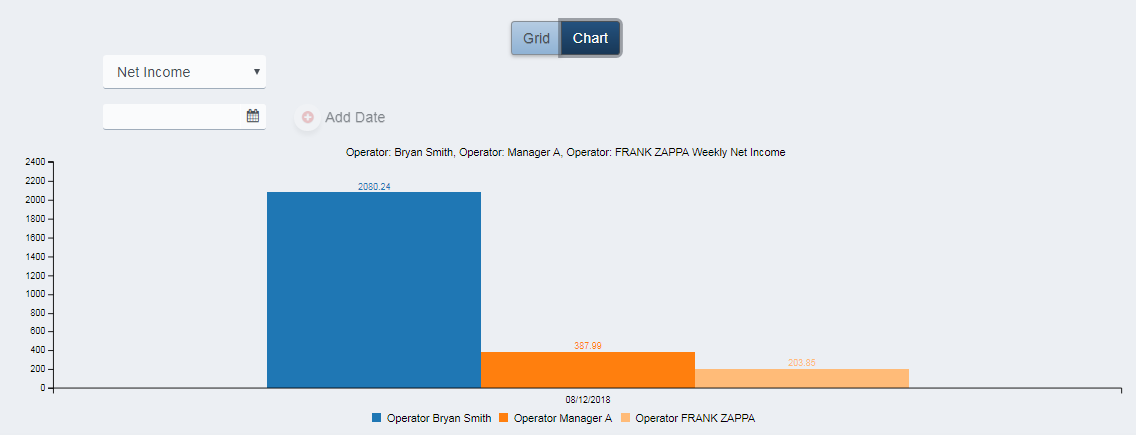
Click the Chart button to display the results as a bar chart.
-
For each operator and period there is a bar in the chart.
-
If the operator/period combinations are <= 6, additional periods can be added.
-
Additional periods are restricted to the same register, same operator, and same period type.
-
Use the calendar control to set the date and clic Add Date.
Screenshot of the Operator Totals application.
- You can set the field to be displayed from the dropdown menu.
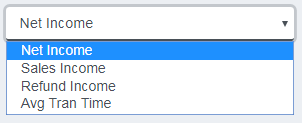
Screenshot of the Operator Totals application.
- Hover the mouse cursor over one of the operator bars to see details for that operator.
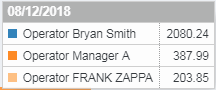
Screenshot of the Operator Totals application.
Other Commands
Export
The Export function allows the user to save the report as a comma-separated values (CSV) file for use in Excel. Once you have a result set that’s filtered as desired, click the Export button. The file is saved as OperatorTotals_yyyy-m-d.csv in the default location, typically the Downloads folder for the user.
The Print function allows the user to save the report as an Acrobat PDF file for viewing/printing in Adobe Acrobat Reader. Once you have a result set that’s filtered as desired, click the Print button. The file is saved as OperatorTotals.pdf in the default location, typically the Downloads folder for the user.