Register Totals
Initial (Main Search) Screen
-
SignOn to the Back Office.
-
From the Reports > Sales Analysis Reports menu, select Register Totals Report.
-
An initial search screen (like the one shown below) should appear:
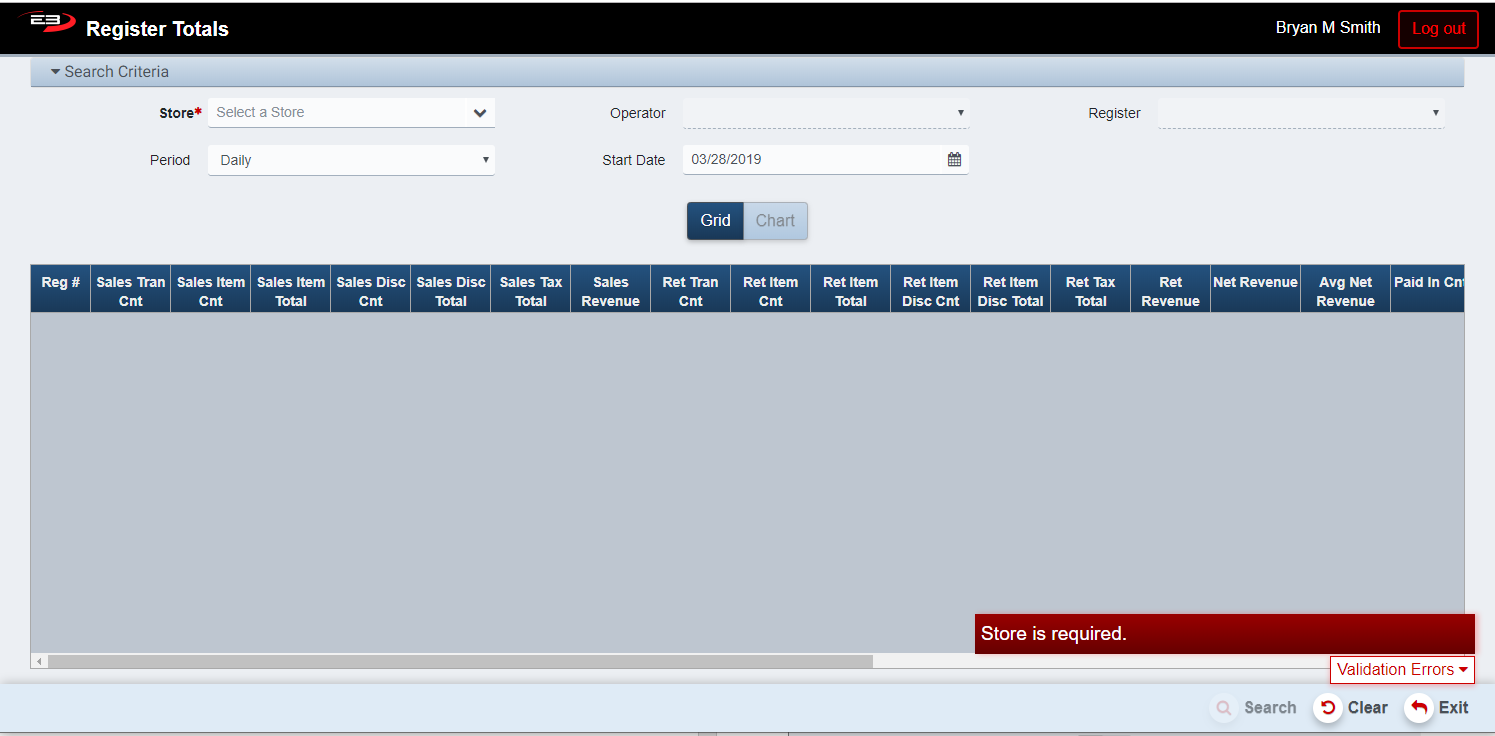
Screenshot of the Register Totals application.
-
Click Clear to reset the search criteria back to their default values.
-
The Store value is required, only one store may be selected from the user’s store visibility list.
-
If only one store is visible to the user, that store is selected by default.
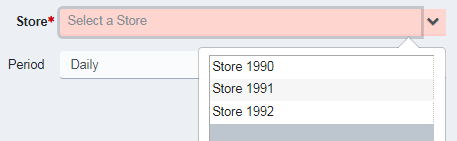
Screenshot of the Register Totals application.
-
Once the store is selected, visible operators and registers are selectable from the Operator and Register criteria.
-
The user may also select a Period and Start Date to filter the results.
-
Periods are: Daily, Weekly, Monthly, Qtrly, and Yearly.
-
The Start Date has a default value for each of the period values and may be manually set as well.
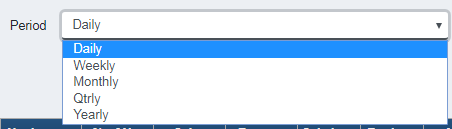
Screenshot of the Register Totals application.
- Click Search, the results will display like the following:
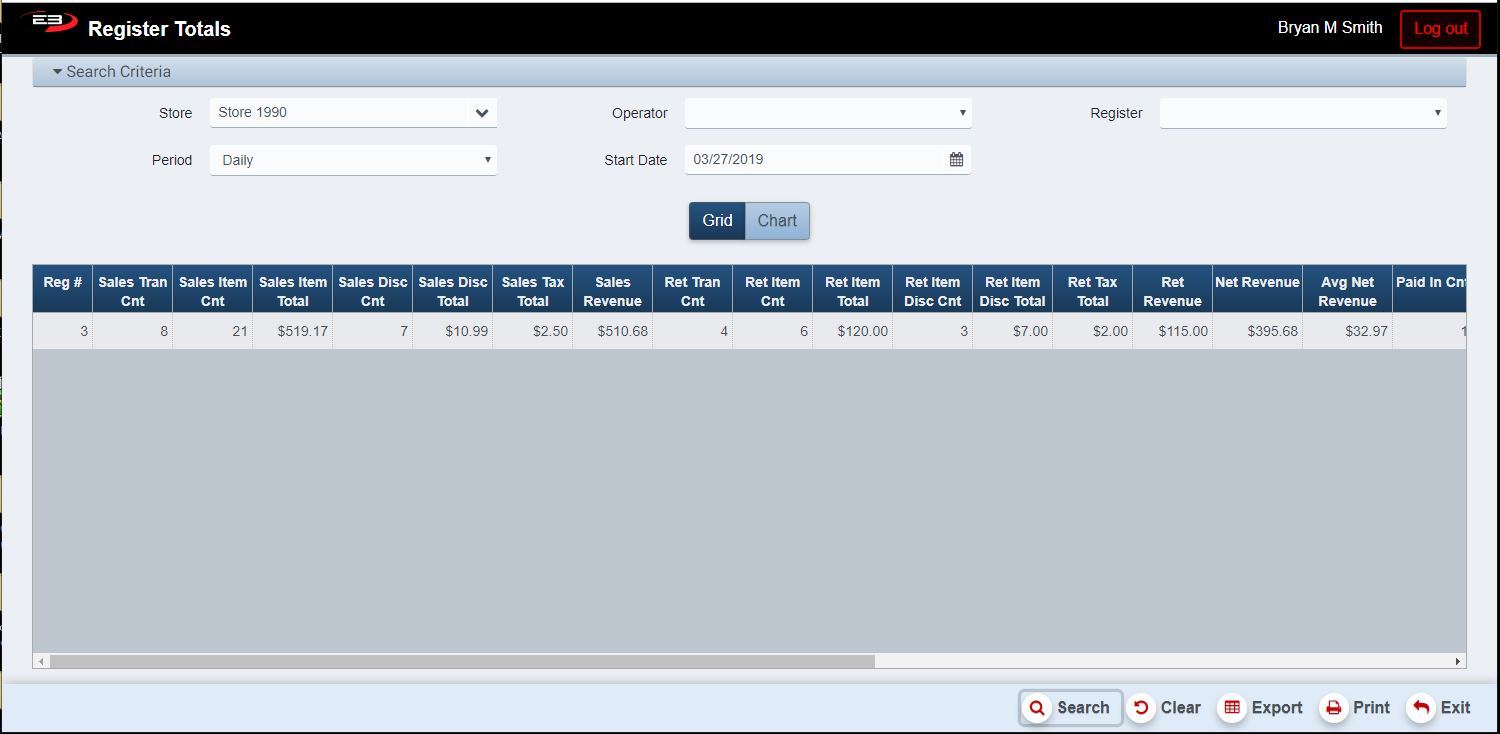
Screenshot of the Register Totals application.
-
Click the Chart button to display the data as a bar chart.
-
If more than one register is available, a Summary row is displayed totalling data from all registers.
Results
The search results can be viewed in two ways: as a grid of results and as a bar graph.
Results Grid
The results grid always contains the following columns, each register gets a row in the results. All results are limited by the selected period in the search criteria.
-
Reg # - this is the register number.
-
Sales Tran Cnt - the number of sales transactions on the register.
-
Sales Item Cnt - the number of items sold on the register.
-
Sales Item Total - the total amount of sales on the register.
-
Sale Disc Cnt - the total number of items sold at a discount on the register.
-
Sales Disc Total - the total amount of discounted items sold on the register.
-
Sales Tax Total - the total amount of sales tax collected on the register.
-
Sales Revenue - the sales item totals minus sales item discounts plus sales tax total.
-
Ret Tran Cnt - the number of return transactions on the register.
-
Ret Item Cnt - the total number of items returned on the register.
-
Ret Item Total - the total amount of items returned on the register.
-
Ret Item Disc Cnt - the total number of items returned at a discount on the register.
-
Ret Item Disc Total - the total amount of items returned at a discount on the register.
-
Ret Tax Total - the total amount of sales tax returned on the register.
-
Ret Revenue - the returns item total minus return item discount total plus return tax total.
-
Net Revenue - the sales income minus the returns income.
-
Avg Net Revenue - Net Revenue / (Sales Tran Cnt + Ret Tran Cnt)
-
Paid In Cnt - the number of Paid In transactions on the register.
-
Paid In Total - the amount of Paid In transactions on the register.
-
Paid Out Cnt - the number of Paid Out transactions on the register.
-
Paid Out Total - the amount of Paid Out transactions on the register.
-
POA Sale Tran Cnt - the number of Payment On Account sale transactions on the register.
-
POA Sale Total - the amount of Payment On Account sale transactions on the register.
-
POA Ret Tran Cnt - the number of Payment On Account return transactions on the register.
-
POA Ret Total - the amount of Payment On Account return transactions on the register.
-
Grand Totals - the Net Income + Paid In Total - Paid Out Total + POA Sale Total - POA Return Total
-
Total Tender Received / Collected - total of tender collected and paid in on the register.
-
Total Tender Issued / Refunded - total amount of tender refunded and paid out on the register.
-
Avg Tran Time - the total transaction time divided by the total number of transactions (sales /returns).
In addition, if there was data for more than one register and no single register was selected, a summary row is displayed with the data for all registers combined.
Results Chart
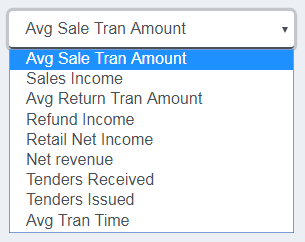
When register data is available, click the Chart button to switch from the Grid view to the Chart view.
-
The value to chart is selected from the drop-list.
-
The default value is Avg Sale Tran Amount.
-
You can select different values to chart from the drop-list without having to return to the search results.
Screenshot of the Register Totals application.
-
If the number of register/period combinations is <= 6, you can add a period.
-
Each additional combination must have the same period, register, and operator.
-
Add a period by selecting the start date from the calendar control and then clicking Add Date.

Screenshot of the Register Totals application.
Other Commands
Export
The Export function allows the user to save the report as a comma-separated values (CSV) file for use in Excel. Once you have a result set that’s filtered as desired, click the Export button. The file is saved as RegisterTotals_yyyy-m-d.csv in the default location, typically the Downloads folder for the user.
The Print function allows the user to save the report as an Acrobat PDF file for viewing/printing in Adobe Acrobat Reader. Once you have a result set that’s filtered as desired, click the Print button. The file is saved as RegisterTotals.pdf in the default location, typically the Downloads folder for the user.