Store Sales Total
Initial (Main Search) Screen
-
From the Reports > Sales Analysis Reports menu, select Store Sales Totals Report.
-
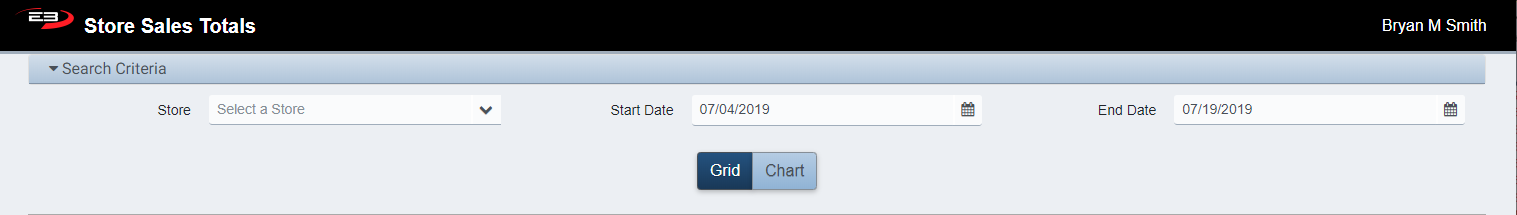
An initial search screen (like the one shown below) should appear.
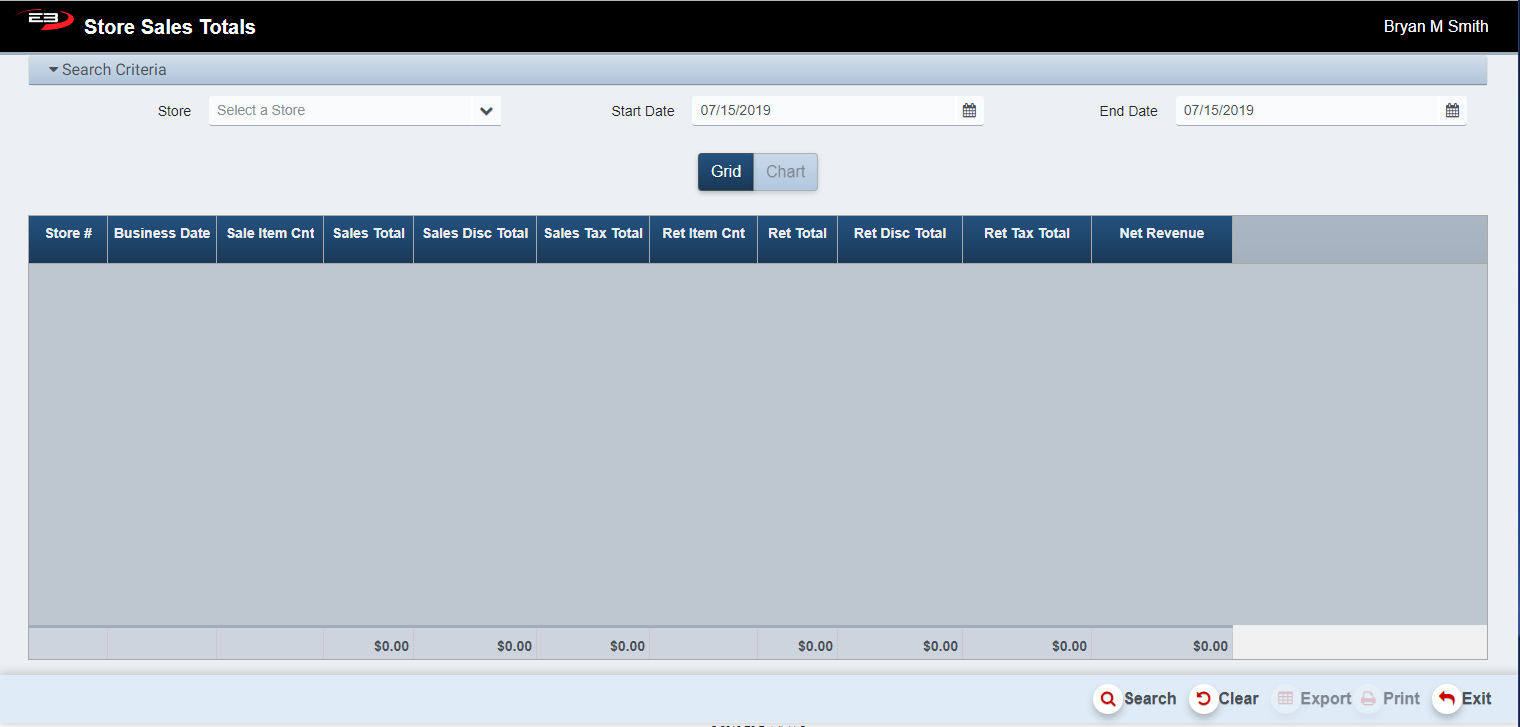
Screenshot of the Store Sales Total application.
-
Click Clear to clear any results and to reset the search criteria back to their default values.
-
The user may select one or more stores from their store visibility list.
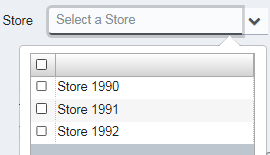
Screenshot of the Store Sales Total application.
-
The user may also select a Start Date and End Date to filter the results.
-
The Start Date and End Date both default to todays date.
-
The date can be set using the calendar control shown below
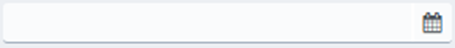
Screenshot of the Store Sales Total application.
- Click Search, the results will display like the following.
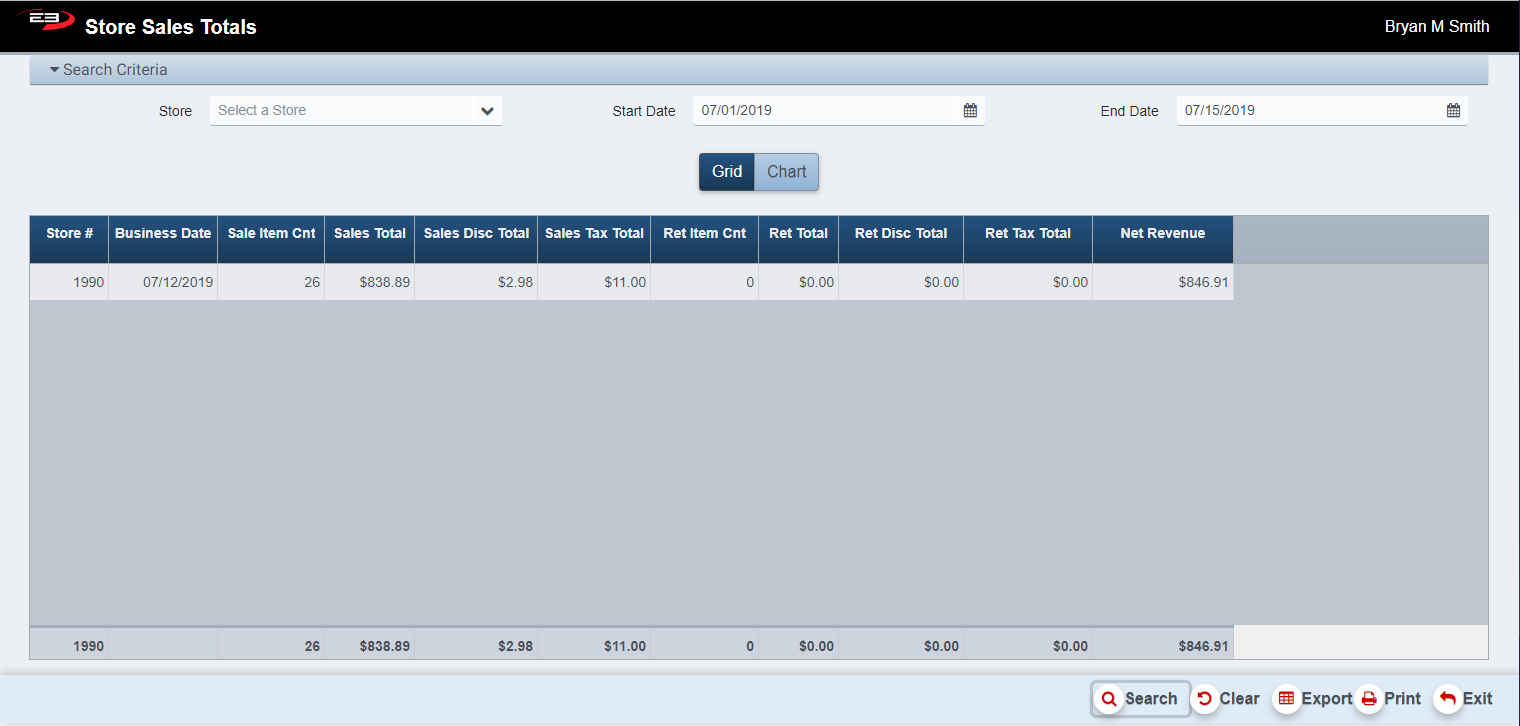
Screenshot of the Store Sales Total application.
Results
There are two different ways in which you can view the results in Store Sales Totals Report - one is in Grid form and the other in Chart form. Clicking on the “Grid” button will display the results in a grid form whereas clicking on the “Chart” button will display the results in a bar chart.
Screenshot of the Store Sales Total application.
Results Grid
-
Choosing to have your Results displayed in Grid form will allow you to look at a single store grid or multiple stores grid.
-
If a single store is selected from the visibility list, or the visibility list has only a single store which is then selected by default, the single store grid is displayed. A total of the store will be shown in the summary row, see below.

Screenshot of the Store Sales Total application.
- If multiple stores are selected from the visibility list, then the multiple store grid is displayed. A total of all the stores will be shown in the summary row, see below.
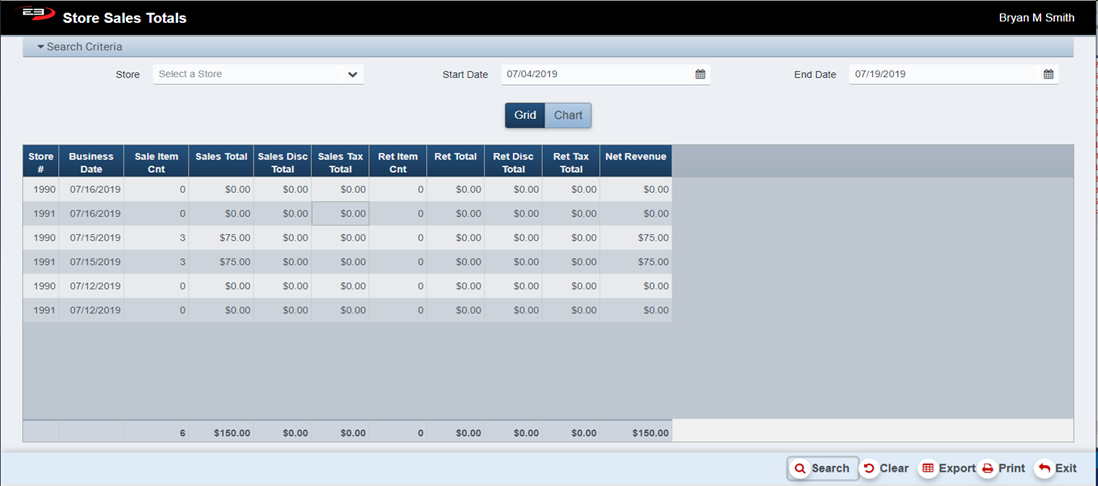
Screenshot of the Store Sales Total application.
The results grid contains the following fields, each row represents a single register:
-
Store # - which store generated this row’s results
-
Business Date – the date that the transactions took place.
-
Sale Item Cnt - the number of sales items in this store on the selected date
-
Sales Total - the total amount of sales in this store on the selected date
-
Sales Disc Total - the total amount of sales discounts in this store on the selected date
-
Sales Tax Total - the total amount of tax collected for sales in this store on the selected date
-
Ret Item Cnt - how many items where returned in this store on the selected date
-
Ret Total - the total amount of returns in this store on the selected date
-
Ret Disc Total - the total amount of return discounts in this store on the selected date
-
Ret Tax Total - the total amount of tax returned from returns in this store on the selected date
-
Net Revenue - Net revenue for this store (Sales total - Return total)
Results Chart
-
Once values are present in the results grid, the Chart button becomes enabled.
-
Click the Chart button to display the results as a bar chart.
-
Which column is to be reported in the chart can be set by picking an entry from the drop list:
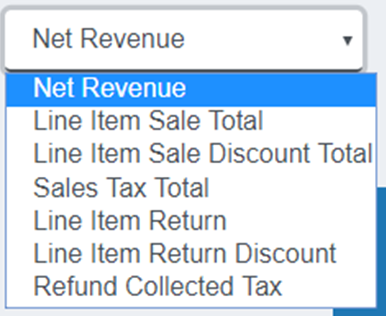
Screenshot of the Store Sales Total application.
- The chart displays the selected column:
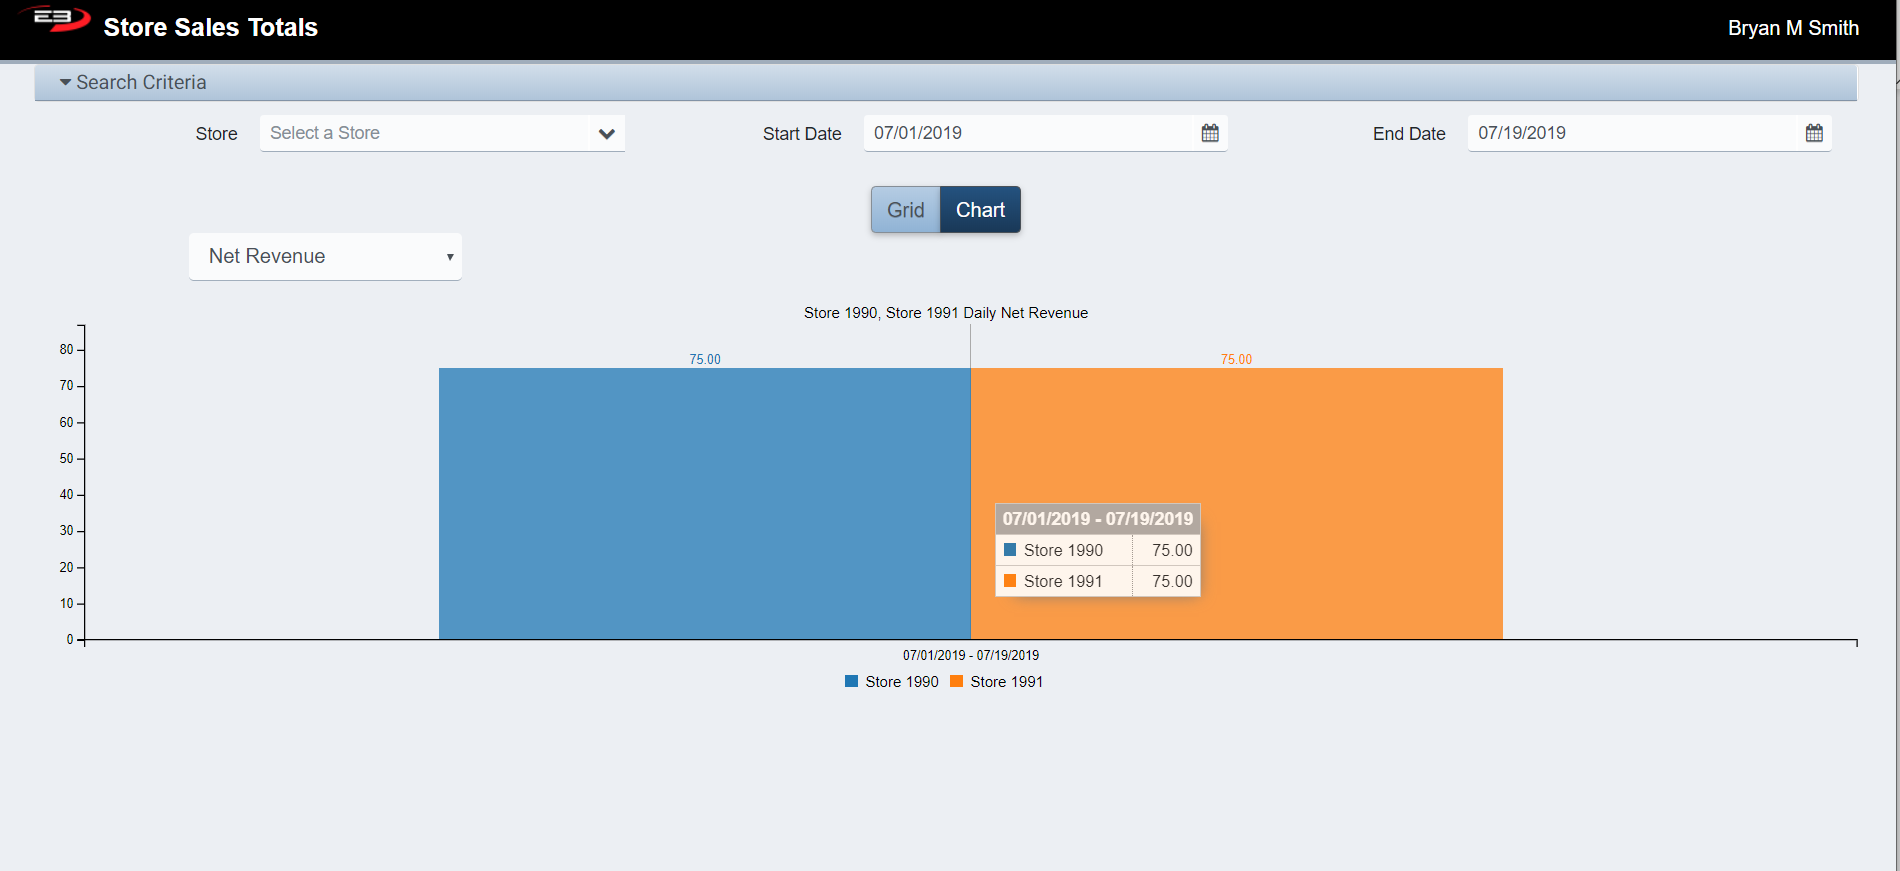
Screenshot of the Store Sales Total application.
- Hover the mouse cursor over a bar to see the details for that time period.
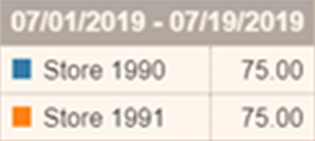
Screenshot of the Store Sales Total application.
Other Commands
Export
The Export function allows the user to save the report as a comma-separated values (CSV) file for use in Excel. Once you have a result set that’s filtered as desired, click the Export button. The file is saved as StoreSalesTotals_yyyy-m-d.csv in the default location, typically the Downloads folder for the user.
The Print function allows the user to save the report as an Acrobat PDF file for viewing/printing in Adobe Acrobat Reader. Once you have a result set that’s filtered as desired, click the Print button. The file is saved as StoreSalesTotals.pdf in the default location, typically the Downloads folder for the user.