Store Totals
Initial (Main Search) Screen
-
From the Reports > Sales Analysis Reports menu, select Store Totals Report.
-
An initial search screen (like the one shown below) should appear.
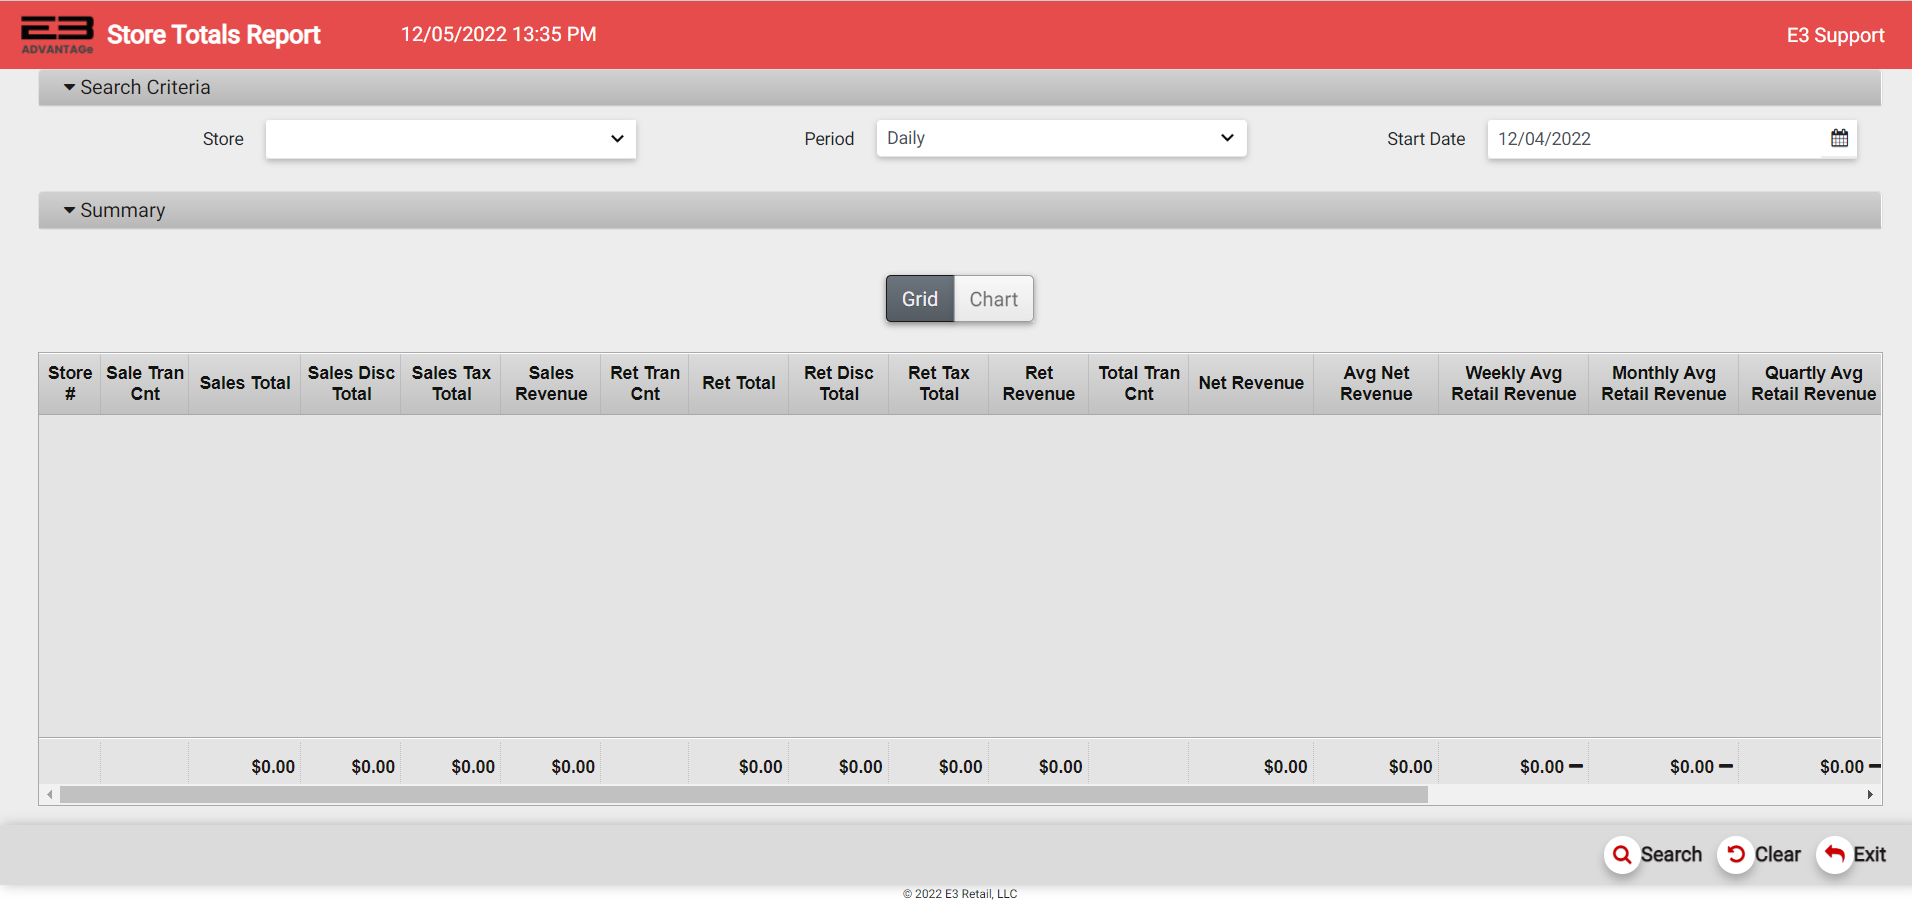
Screenshot of the Store Totals application.
-
Click Clear to clear any results and reset the search criteria back to their default values.
-
The user may select one or more stores from their store visibility list.
-
The user may also select a Period and Start Date to filter the results.
-
Periods are: Daily, Weekly, Monthly, Qtrly, and Yearly.
-
The Start Date has a default value for each of the periods and may also be manually set.
-
Click Search, the results will display like the following.
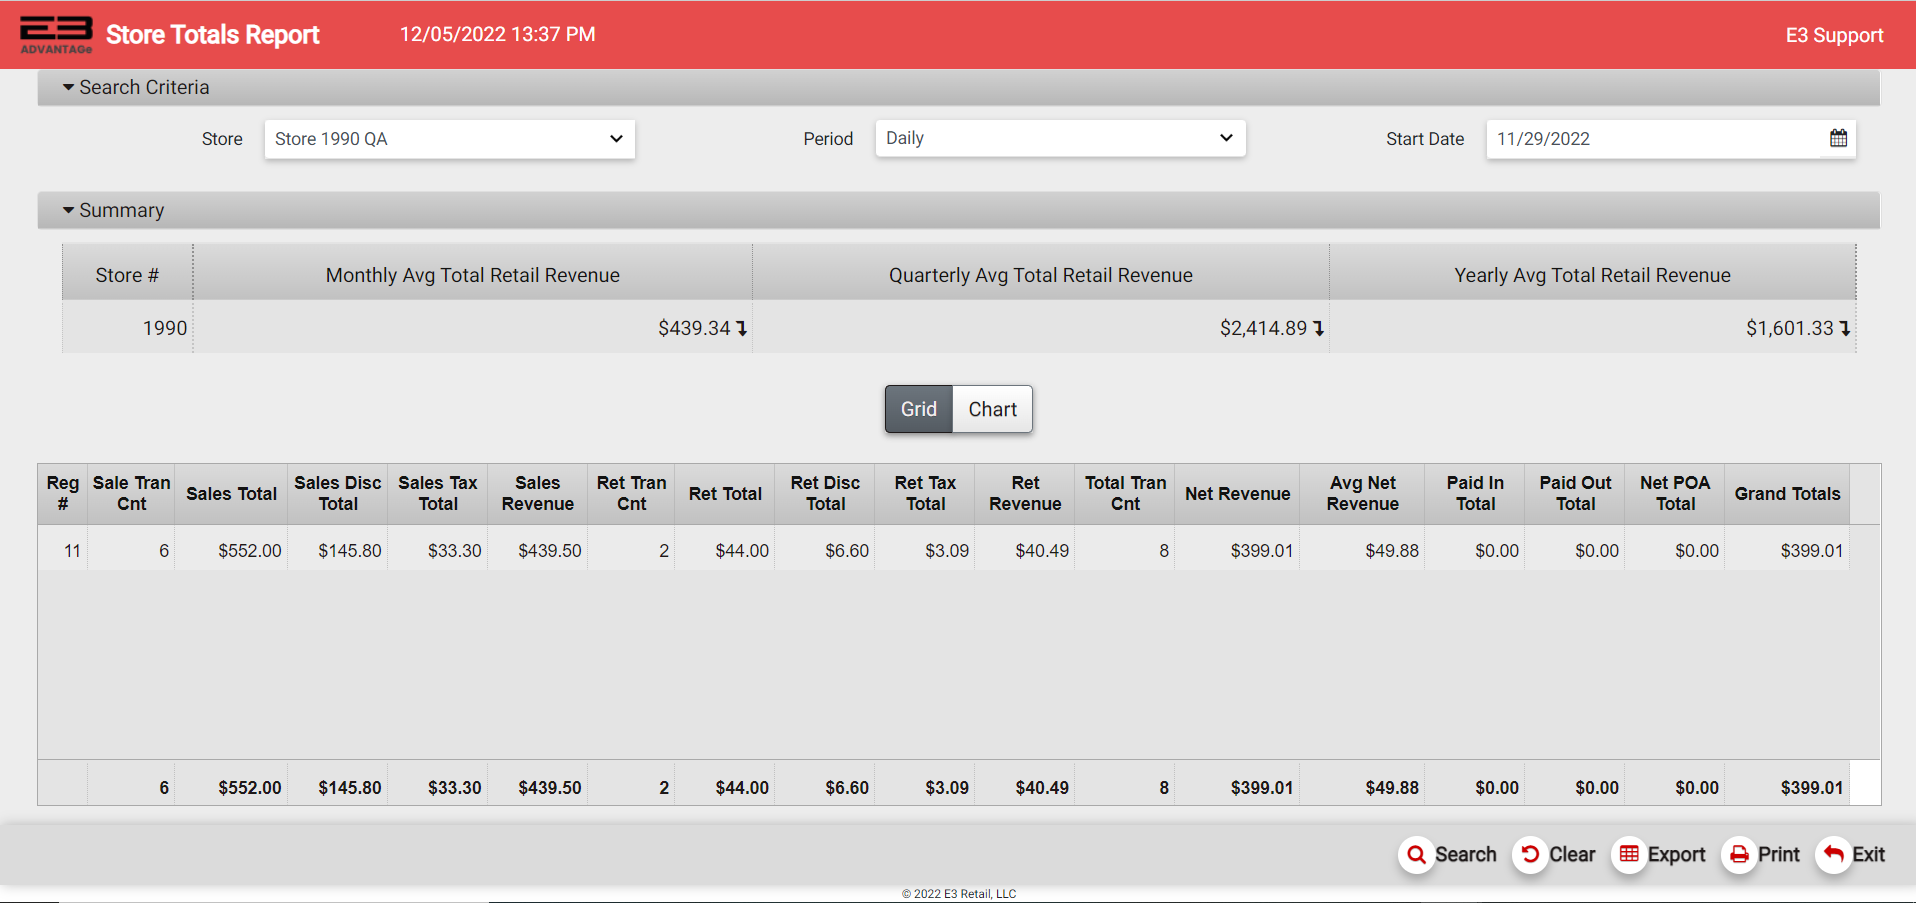
Screenshot of the Store Totals application.
-
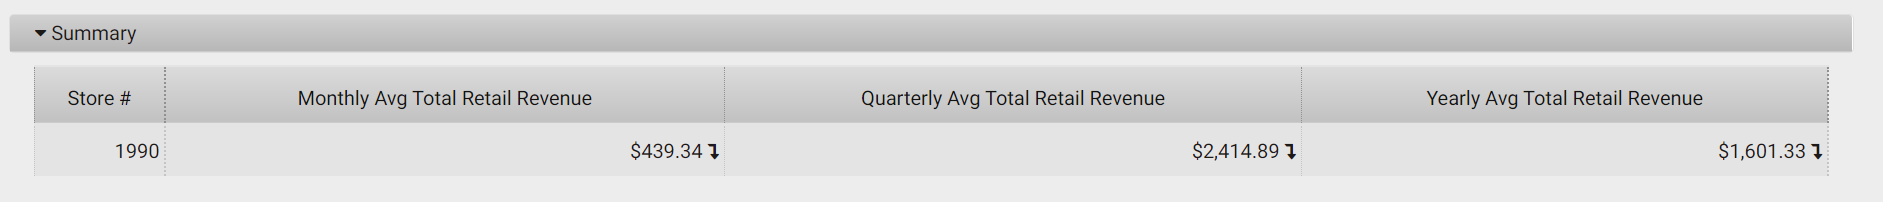
The period averages and trend indicators for that store appear in a summary row.
-
Only the averages and indicators for period greater than the selected period are shown, as an example if the Daily period was selected the averages and indicators for Weekly, Monthly, Quarterly, and Yearly are shown.
-
If the selected period was Monthly, then only the Quarterly and Yearly results would be shown; this restriction also applies to the in-row values for multiple store and Enterprise view selections.
Screenshot of the Store Totals application.
Results
Results Grid
There are three different result grids that may be displayed depending on the store selection: single store grid, multiple store grid, and Enterprise store grid. Each type of result grid contains Average Retail Income values based on time periods, these are shown with trend indicators. The trend indicators can be up, neutral, or down.
Single Store Grid
If a single store is selected from the visiblity list, or the visibility list has only a single store which is then selected by default, the single store grid is displayed.
The period averages and trend indicators for the single store appear as a summary row above the results.
-
Average Retail Revenue values based on time periods are shown with trend indicators.
-
Weekly Avg Retail Revenue
-
Monthly Avg Retail Revenue
-
Qtrly Avg Retail Revenue
-
Yearly Avg Retail Revenue
-
-
Average income values and trends are only shown for time periods longer than the selected time period.
-
The trend indicators can be up, neutral, or down.
The results grid for a single store contains the following fields, each row represents a single register:
-
Reg # - which register number generated this rows’s results
-
Sale Tran Cnt - the number of sales transactions on this register during the selected period
-
Sales Total - the total amount of sales on this register during the selected period
-
Sales Disc Total - the total amount of sales discounts on this register during the selected period
-
Sales Tax Total - the total amount of tax collected for sales on this register during the selected period
-
Sales Revenue - the amount for (Sales Totals - Sales Discounts Total + Sales Tax Total)
-
Ret Tran Cnt - how many return transactions for this register during the selected period
-
Ret Total - the total amount of returns on this register during the selected period
-
Ret Disc Total - the total amount of return discounts on this register during the selected period
-
Ret Tax Total - the total amount of tax returned from returns on this register during the selected period
-
Ret Revenue - the amount for (Return Totals - Return Discounts Total + Return Tax Total)
-
Total Tran - the total number of sales plus return transactions on this register during the selected period
-
Net Revenue - Net revenue for this store (Sales revenue - Return revenue)
-
Avg Net Revenue - Net revenue divided by the number of transactions (sales + returns)
-
Paid In Total - total amount for Paid In transactions
-
Paid Out Total - total amount for Paid Out transactions
-
Net POA Total - total amount of Payment On Account sales minus Payment On Account refunds
-
Grand Totals - (Total Retail Income + PaidInTotal - PaidOutTotal + NetPOATotal)
-
A summary row at the bottom of the results displays the totals for all registers in the selected store.
Multiple Store Grid
If multiple stores are selected from the visiblity list, the multiple store grid is displayed.

Screenshot of the Store Totals application.
The period averages and trend indicators for multiple stores appear in each store’s row.
-
Average Retail Income values based on time periods are shown with trend indicators.
-
Average income values and trends are only shown for time periods longer than the selected time period.
-
The trend indicators can be up, neutral, or down.
The results grid for multiple stores contains the following fields, each row represents a single store:
-
Store # - which register generated this row’s results
-
Sale Tran Cnt - the number of sales transactions on this register during the selected period
-
Sales Total - the total amount of sales on this register during the selected period
-
Sales Disc Total - the total amount of sales discounts on this register during the selected period
-
Sales Tax Total - the total amount of tax collected for sales on this register during the selected period
-
Sales Revenue - the amount for (Sales Totals - Sales Discounts Total + Sales Tax Total)
-
Ret Tran Cnt - how many return transactions for this register during the selected period
-
Ret Total - the total amount of returns on this register during the selected period
-
Ret Disc Total - the total amount of return discounts on this register during the selected period
-
Ret Tax Total - the total amount of tax returned from returns on this register during the selected period
-
Ret Revenue - the amount for (Return Totals - Return Discounts Total + Return Tax Total)
-
Total Tran - the total number of sales plus return transactions on this register during the selected period
-
Net Revenue - Net revenue for this store (Sales revenue - Return revenue)
-
Avg Net Revenue - Net revenue divided by the number of transactions (sales + returns)
-
Weekly Avg Total Retail Revenue - displayed if Period < Weekly, includes trend indicator
-
Monthly Avg Total Retail Revenue - displayed if Period < Monthly, includes trend indicator
-
Qtrly Avg Total Retail Revenue - displayed if Period < Quarterly, includes trend indicator
-
Yearly Avg Total Retail Revenue - displayed if Period < Yearly, includes trend indicator
-
Paid In Total - total amount for Paid In transactions from this store
-
Paid Out Total - total amount for Paid Out transactions from this store
-
Net POA Total - total amount of Payment On Account sales minus Payment On Account refunds from this store
-
Grand Totals - (Net Revenue + PaidInTotal - PaidOutTotal + NetPOATotal) from this store
-
A summary row at the bottom of the results displays the totals for all selected stores.
Enterprise Store Grid
If the visibility list contains multiple stores but no store is selected, the Enterprise store grid is displayed.
The period averages and trend indicators for stores in the Enterprise view appear in each store’s row.
-
Average Retail Income values based on time periods are shown with trend indicators.
-
Average income values and trends are only shown for time periods longer than the selected time period.
-
The trend indicators can be up, neutral, or down.
The results grid for the Enterprise view contains the following fields, each row represents a single store:
-
Store # - which store generated this row’s results
-
Sale Tran Cnt - the number of sales transactions on this register during the selected period
-
Sales Total - the total amount of sales on this register during the selected period
-
Sales Disc Total - the total amount of sales discounts on this register during the selected period
-
Sales Tax Total - the total amount of tax collected for sales on this register during the selected period
-
Sales Revenue - the amount for (Sales Totals - Sales Discounts Total + Sales Tax Total)
-
Ret Tran Cnt - how many return transactions for this register during the selected period
-
Ret Total - the total amount of returns on this register during the selected period
-
Ret Disc Total - the total amount of return discounts on this register during the selected period
-
Ret Tax Total - the total amount of tax returned from returns on this register during the selected period
-
Ret Revenue - the amount for (Return Totals - Return Discounts Total + Return Tax Total)
-
Total Tran - the total number of sales plus return transactions on this register during the selected period
-
Net Revenue - Net revenue for this store (Sales revenue - Return revenue)
-
Avg Net Revenue - Net revenue divided by the number of transactions (sales + returns)
-
Weekly Avg Total Retail Income - displayed if Period < Weekly, includes trend indicator
-
Monthly Avg Total Retail Income - displayed if Period < Monthly, includes trend indicator
-
Qtrly Avg Total Retail Income - displayed if Period < Quarterly, includes trend indicator
-
Yearly Avg Total Retail Income - displayed if Period < Yearly, includes trend indicator
-
Paid In Total - total amount for Paid In transactions from this store
-
Paid Out Total - total amount for Paid Out transactions from this store
-
Net POA Total - total amount of Payment On Account sales minus Payment On Account refunds from this store
-
Grand Totals - (Total Retail Income + PaidInTotal - PaidOutTotal + NetPOATotal) from this store
-
A summary row at the bottom of the results displays the totals for all stores.
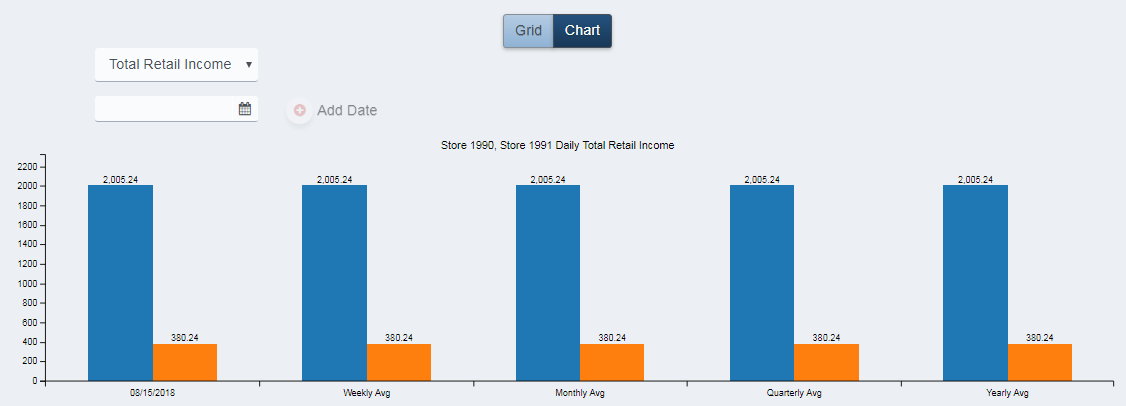
Results Chart
-
Once values are present in the results grid, the Chart button becomes enabled.
-
Click the Chart button to display the results as a bar chart.
-
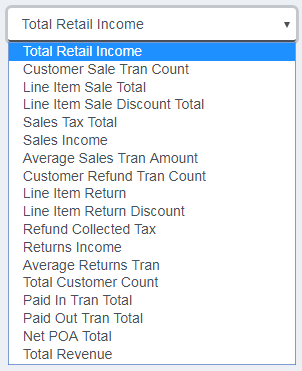
Which column is to be reported in the chart can be set by picking an entry from the dropdown menu:
Screenshot of the Store Totals application.
- The date can be set using the calendar control:

Screenshot of the Store Totals application.
- The chart displays the selected column:
Screenshot of the Store Totals application.
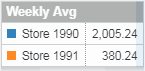
- Hover the mouse cursor over a bar to see the details for that time period.
Screenshot of the Store Totals application.
Adding Additional Periods To The Graph
You can add additional periods (up to 5) to the graph subject to the following rules:
-
For single store selected, the store and period type must be the same
-
For multiple stores selected, the stores and period type must be the same
-
For the Enterprise view, the period type must be the same
In other words, you can add periods that look at the same store(s) over different period(s) of time, subject to the constraint that the time periods are the same. type Thus, you can’t compare days to weeks or any other comparison where the periods are not the same type.
Other Commands
Export
The Export function allows the user to save the report as a comma-separated values (CSV) file for use in Excel. Once you have a result set that’s filtered as desired, click the Export button. The file is saved as StoreTotals_yyyy-m-d.csv in the default location, typically the Downloads folder for the user.
The Print function allows the user to save the report as an Acrobat PDF file for viewing/printing in Adobe Acrobat Reader. Once you have a result set that’s filtered as desired, click the Print button. The file is saved as StoreTotals.pdf in the default location, typically the Downloads folder for the user.